MHOL
  • Home
  • Quick Links Menu
    MHJC Wiki MHJC ePassport Student Information DEEP Options Academic Competitions
    Reading Plus Lexia Core 5 Maths Buddy e asTTle Library eBooks Email Linguascope ESOL Resources
  • More
Close
Toggle search input
You are currently using guest access
Log in
MHOL
Home Quick Links Menu Collapse Expand
MHJC Wiki MHJC ePassport Student Information DEEP Options Academic Competitions Reading Plus Lexia Core 5 Maths Buddy e asTTle Library eBooks Email Linguascope ESOL Resources
Expand all Collapse all
  1. 10C1MAT20
  2. Example of Table of values and graph

Example of Table of values and graph

Completion requirements

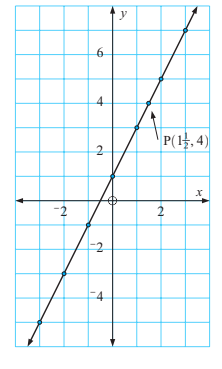
Plot the graph from the values in the table.

You use the values in the table as x and y coordinates to plot your graph, as shown in the example. The graph should have four quadrants with negative and positive values shown. 

After plotting the coordinates, you join them in a straight line to get a linear graph.

    • Graph.png
    • Table of values.png
You are currently using guest access (Log in)
Data retention summary
Get the mobile app
Powered by Moodle