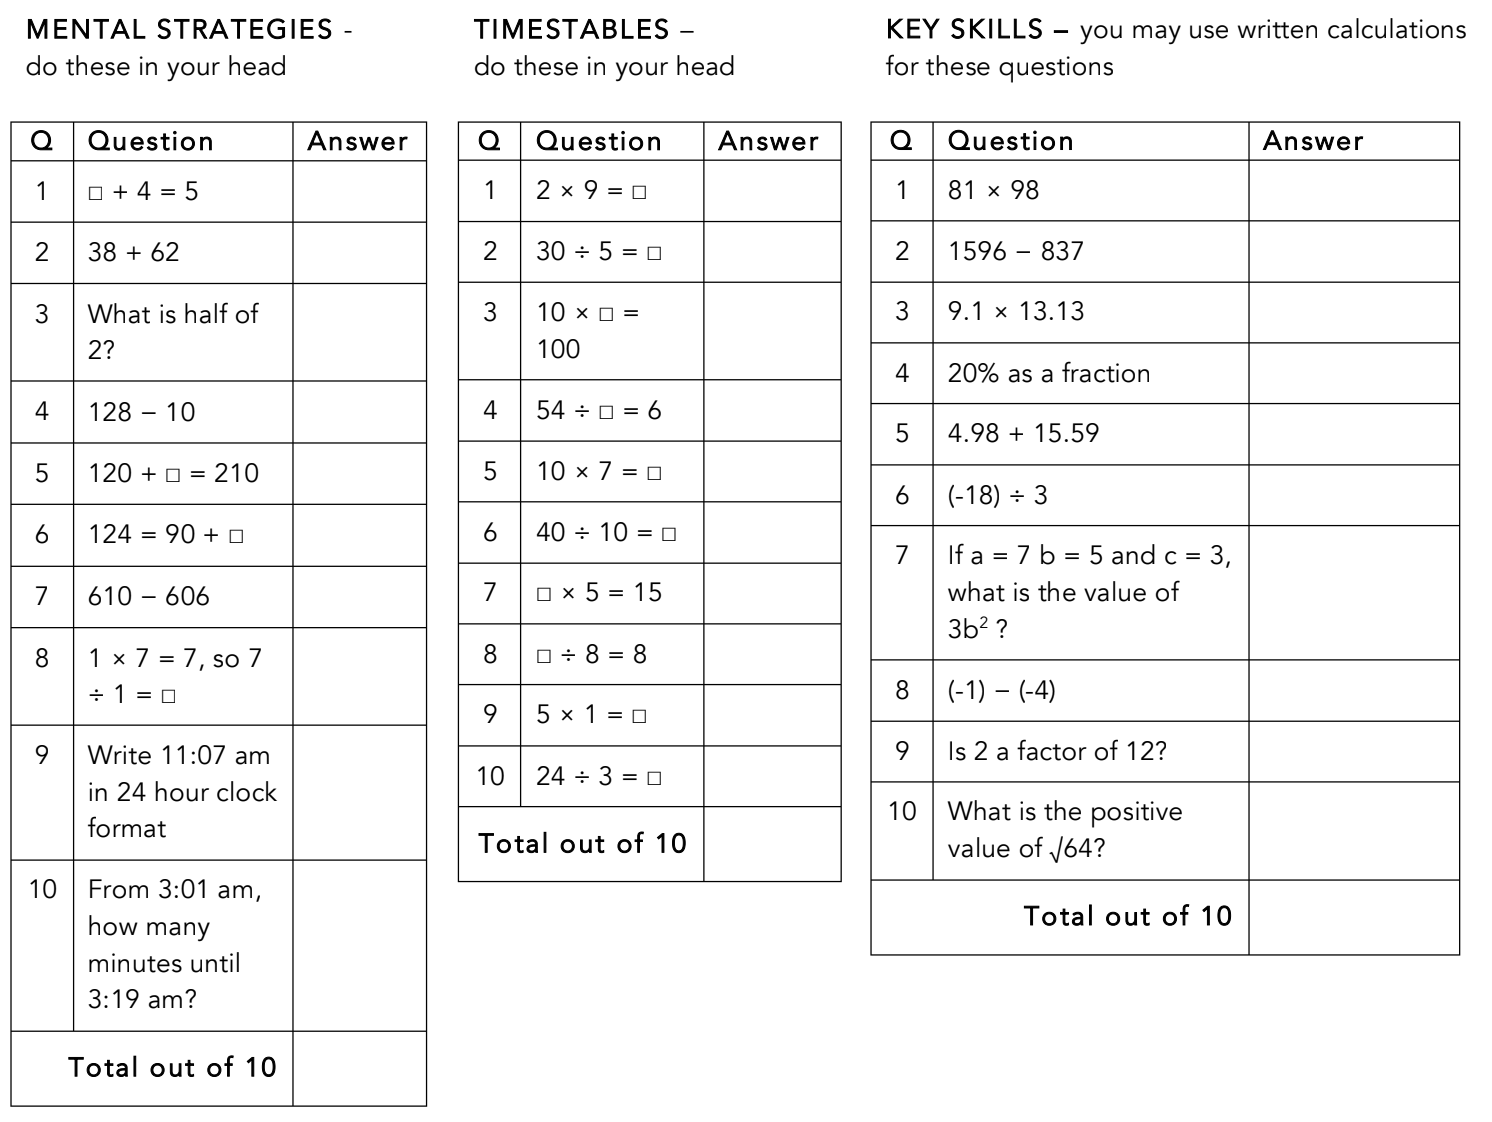
Term 1 Week 3
Section outline
-
EXPLORE / TŪHURA learning intentions:
- We are EXPLORING...statistics of sea life by analysing how to read and draw graphs.
- We are EXPLORING...statistics of sea life by recognising that there are different types of graphs.
- We are EXPLORING...statistics of sea life by calculating the averages of sets of values
Success Criteria:
- I can calculate the mean from a set of data.
- I can calculate the median from a set of data.
- I can calculate the range and mode from a set of data
- I can identify different types of data
Activities:
- Mean, median, mode, range worksheet on Google Classroom
- Learning about the different types of data and the graphs that can be drawn from them
Tuesday 13 Feb:

Wednesday 14 Feb:

