Term 1: Week 10
Section outline
-

PLAN & DO / WHAKAMAHI learning intentions:
- We are PLANNING to collect data so that we can identify marine species at Goat iSLAND Marine Reserve
- We are PLANNING to display data so that information is displayed effectively
- We are learning to analyse data by calculating mean, median, mode and range.

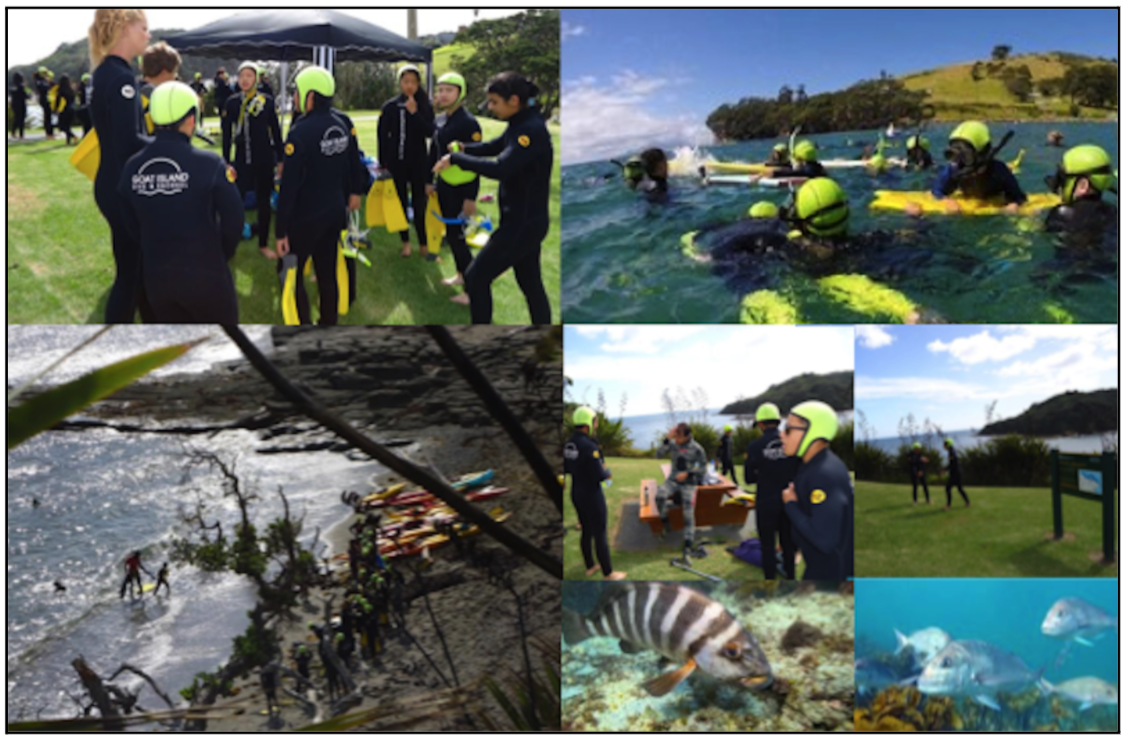
Kia ora 8F1. How exciting - your EOTC trip to the ‘ Goat Island Marine Reserve' is this Thursday!
Whakataukī: “He manako te kōura e kore ai ”
Metaphorical: The wish for fish will bring none.
Literal: Dreams require action to become realityAuthentic Outcomes: Snorkelling and attendance at the Goat Island Marine Education Centre. Social action, working towards a more sustainable future.
Success Criteria: I can..
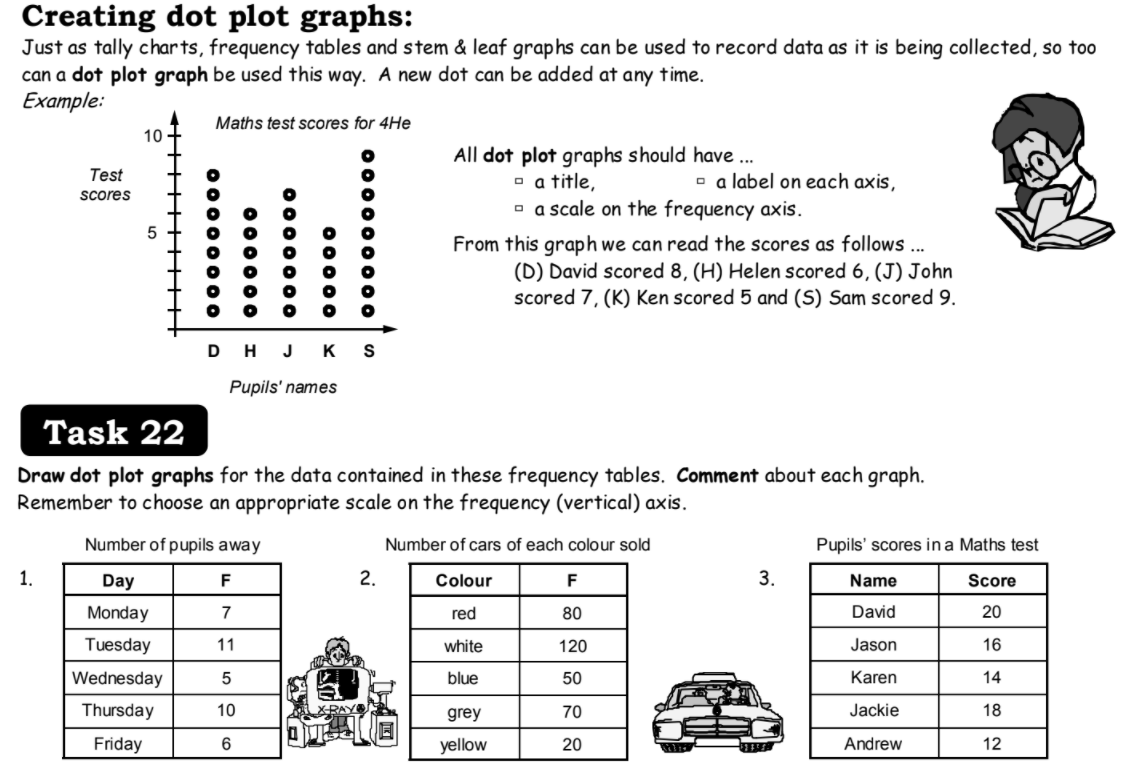
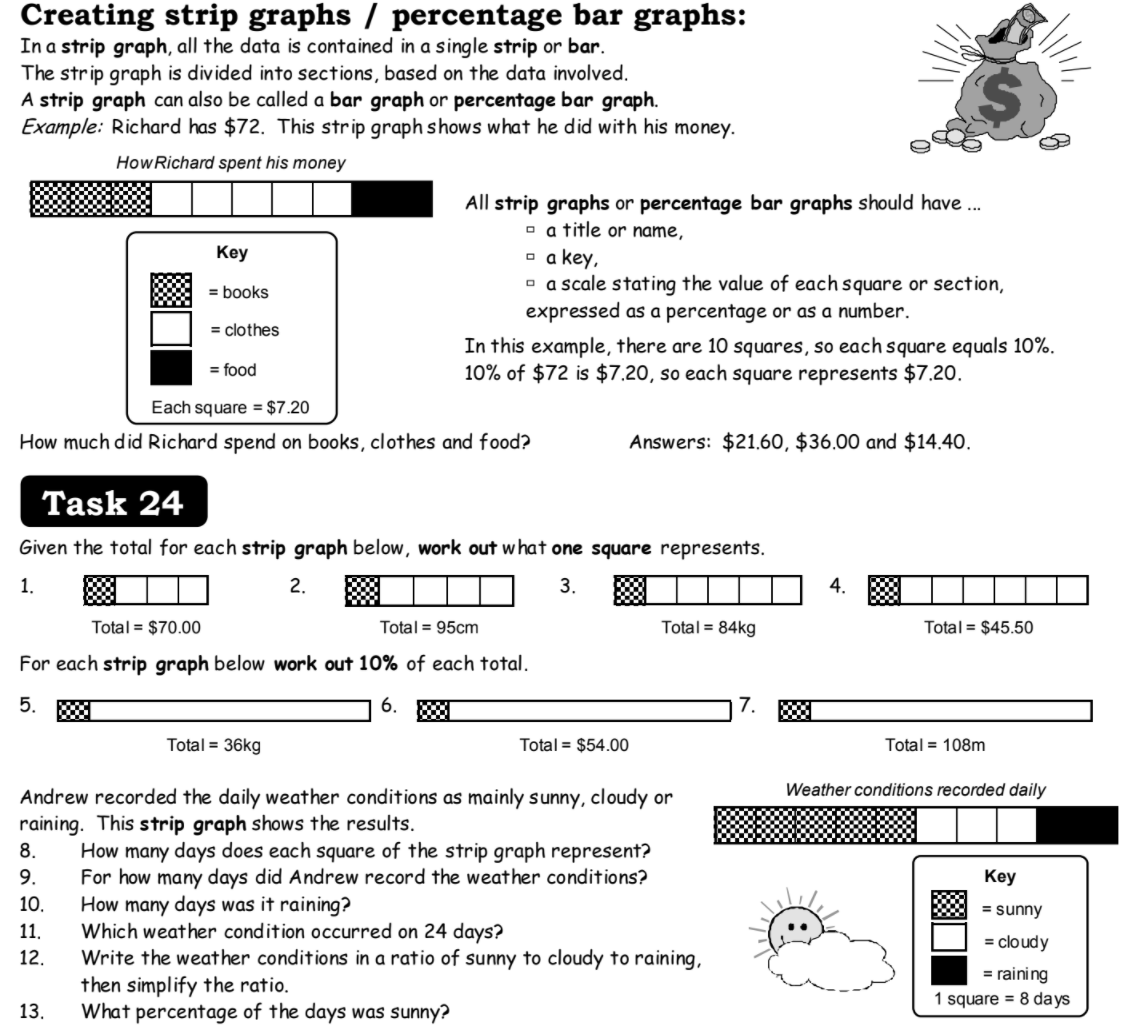
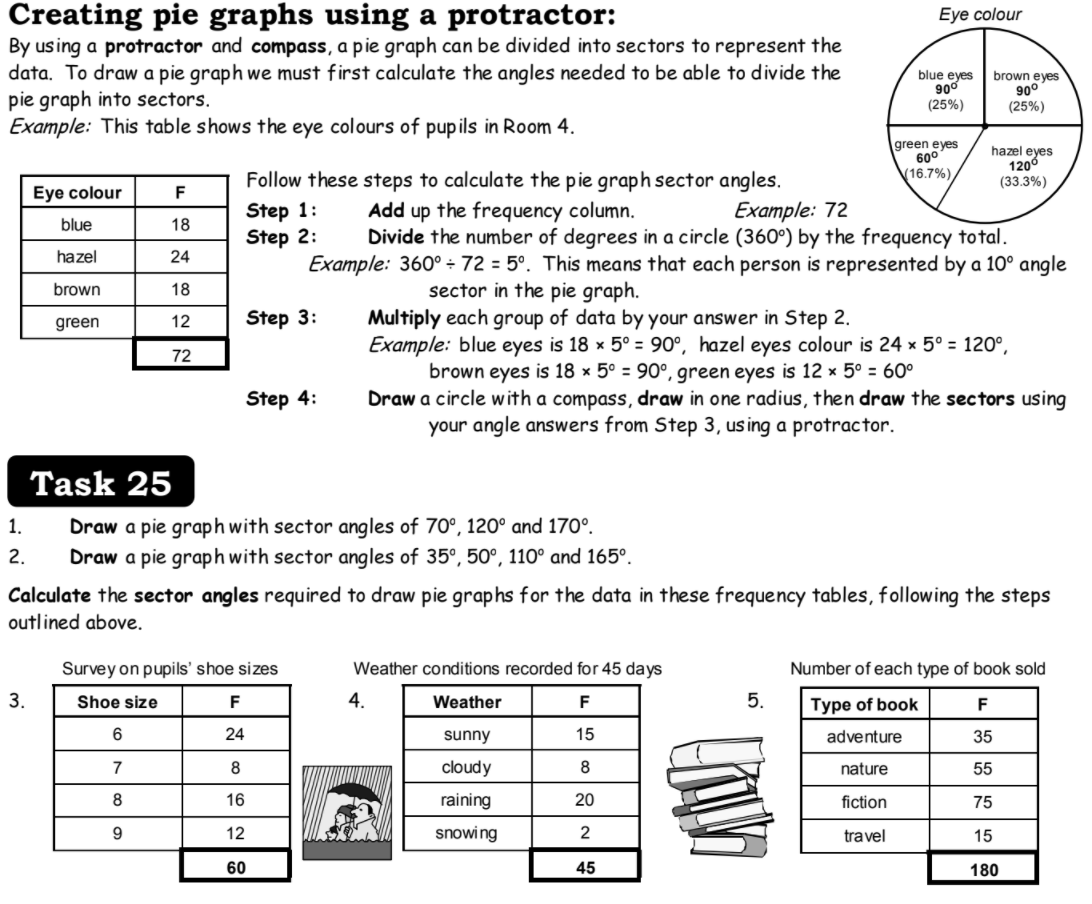
• Displaying grouped data : Pictogram, strip graph, pie graph , time-series graph
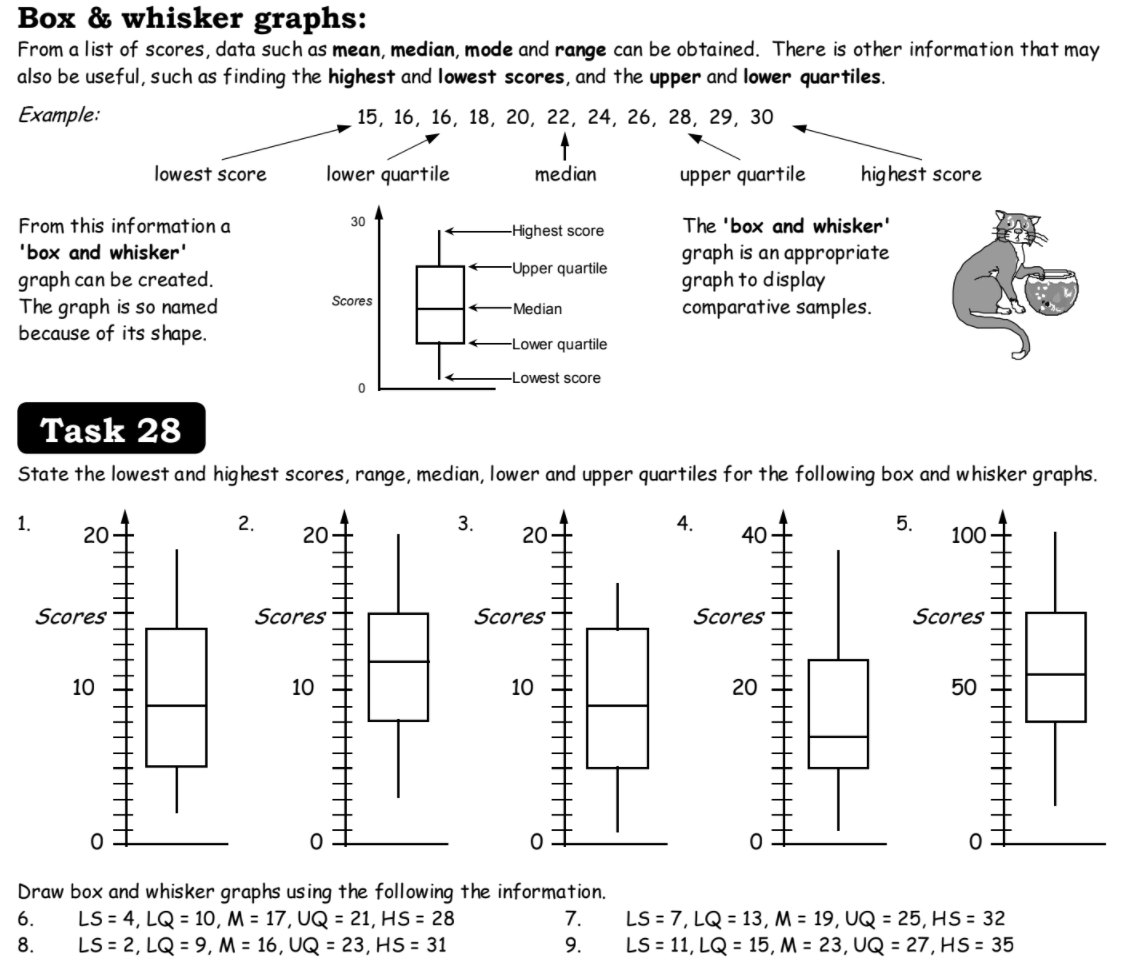
* Display:time-series graph , box & whiskers graph
* Apply statistical information
* Numeracy Ninjas: Mental Strategies, Timetables and Key Skills revision.
Tuesday: Ninja Maths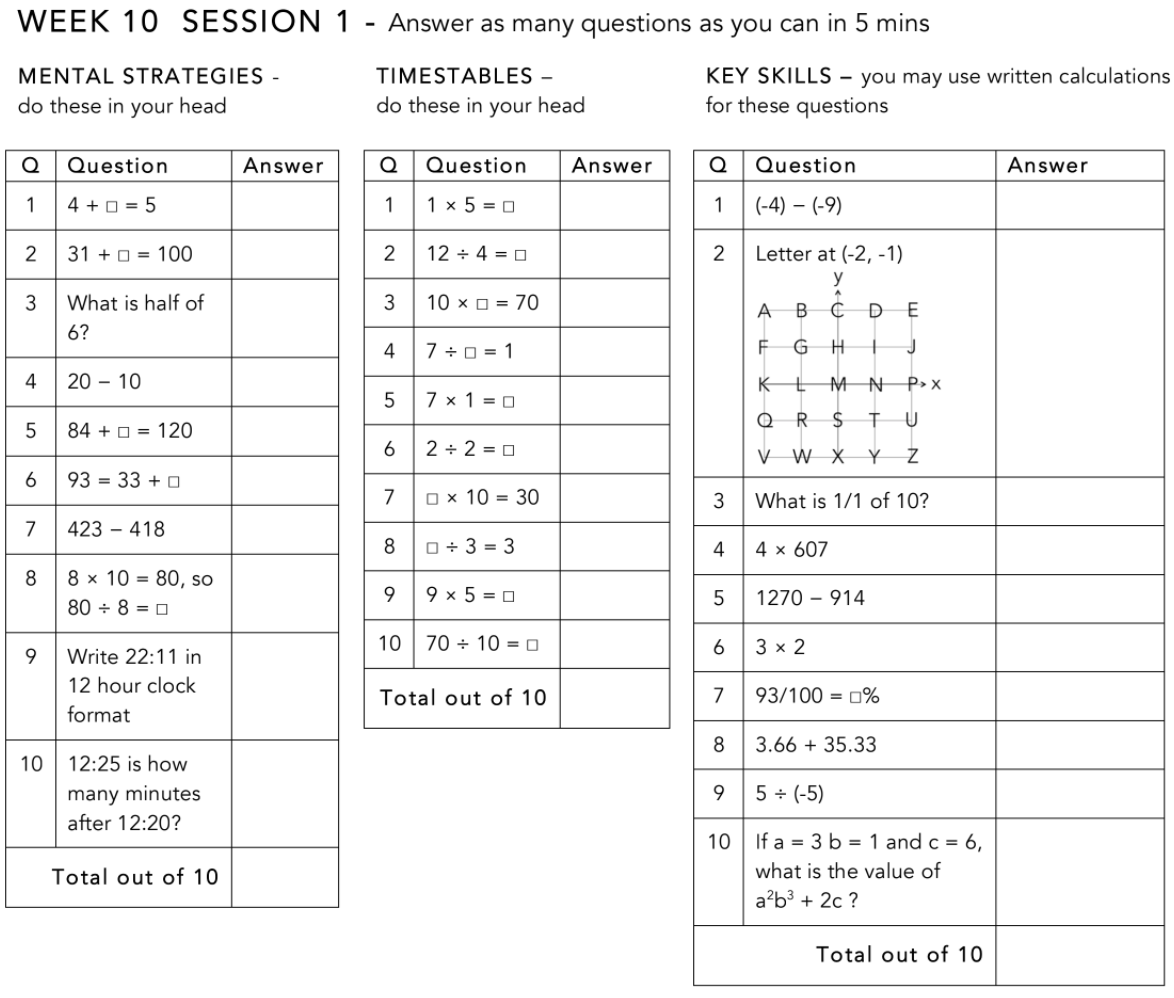
Wednesday Ninja Math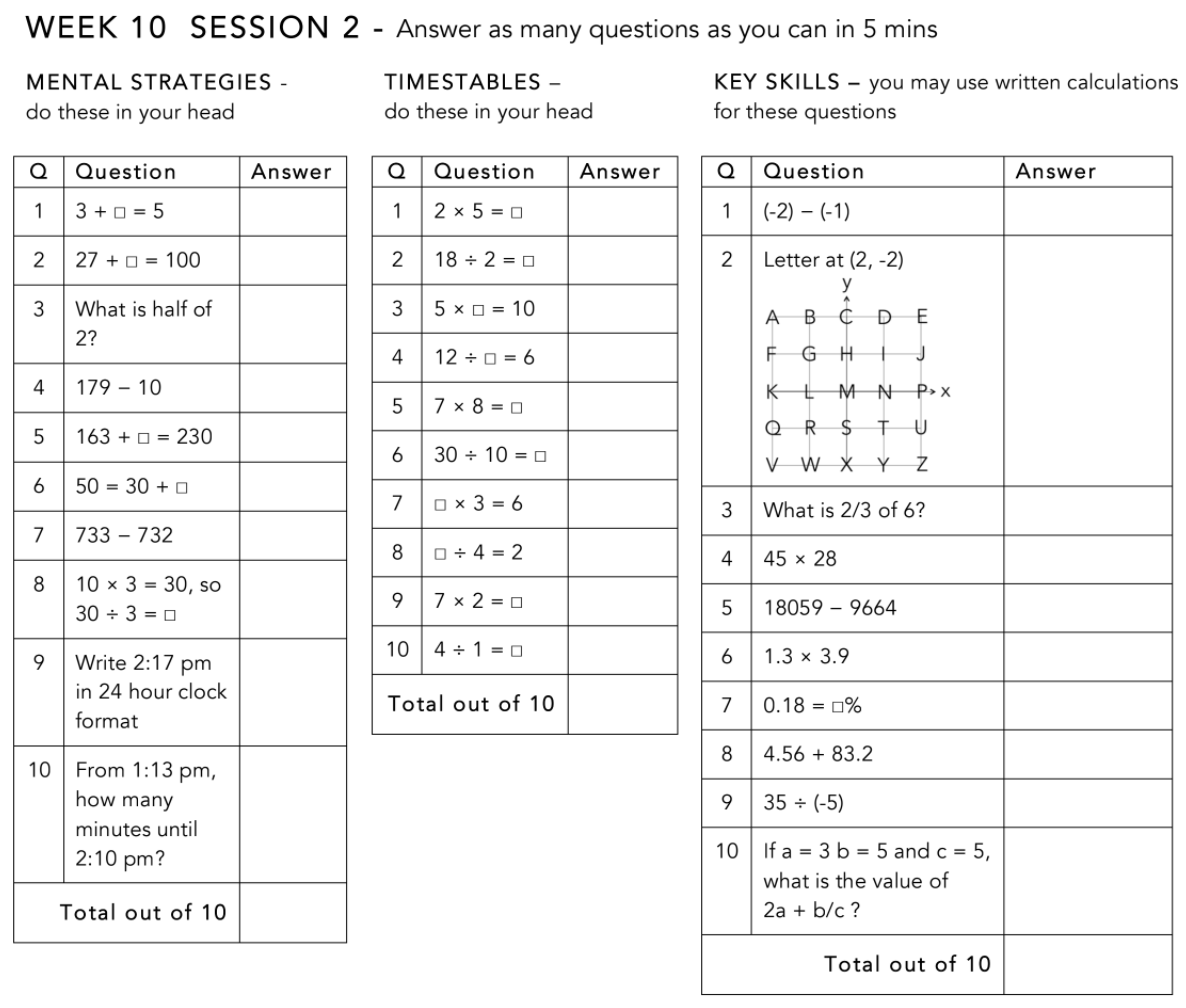
Tuesday:
1. Hei Mahi:
2. Koronga Ako:
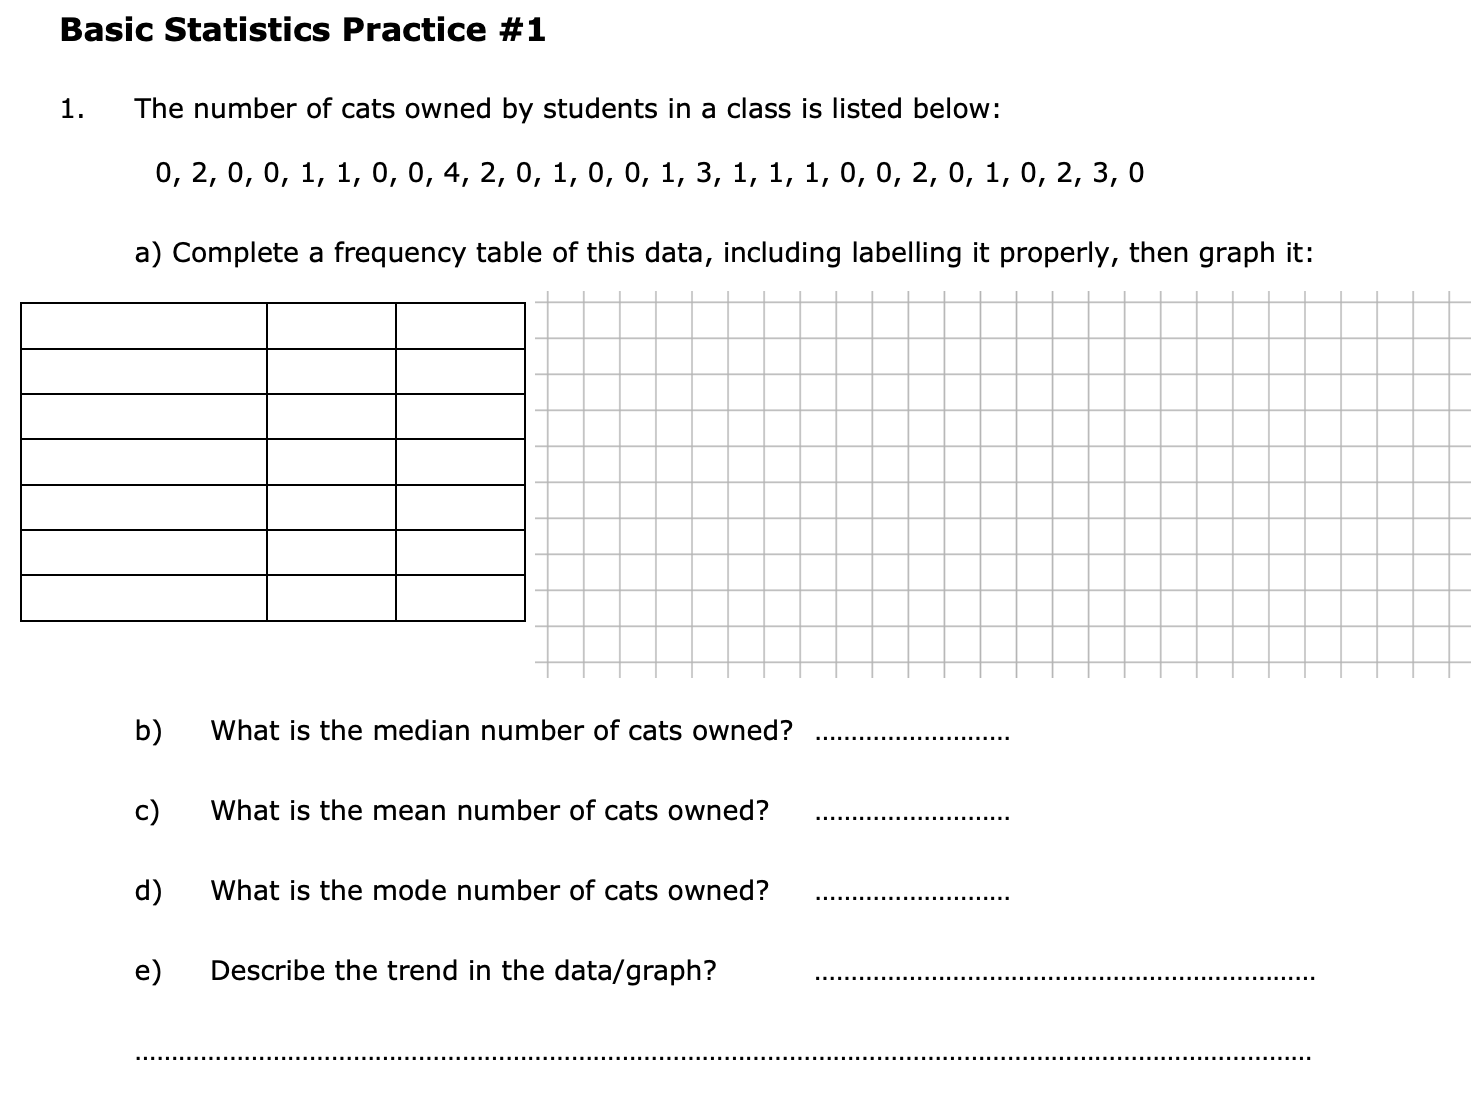
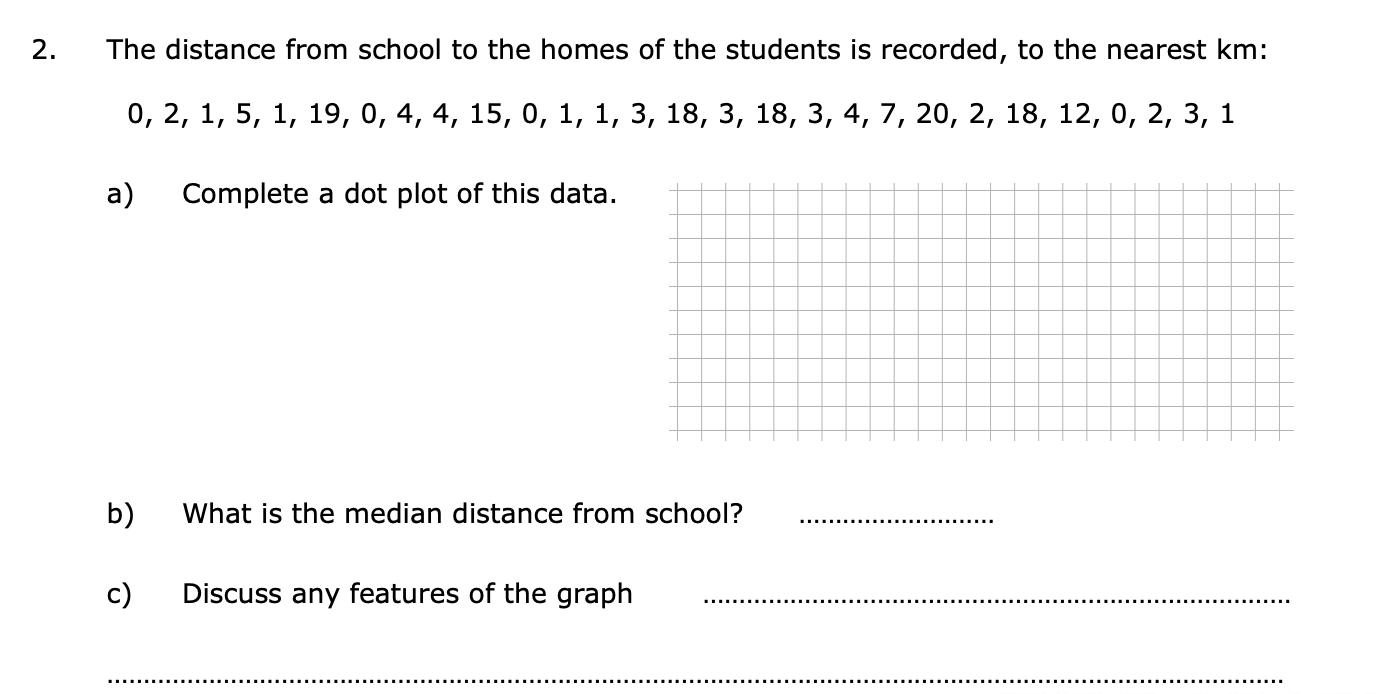
Explore: Dot plot graphs, strip graphs ,pie graphs,
Wednesday:
1. Hei Mahi:
2. Koronga Ako:
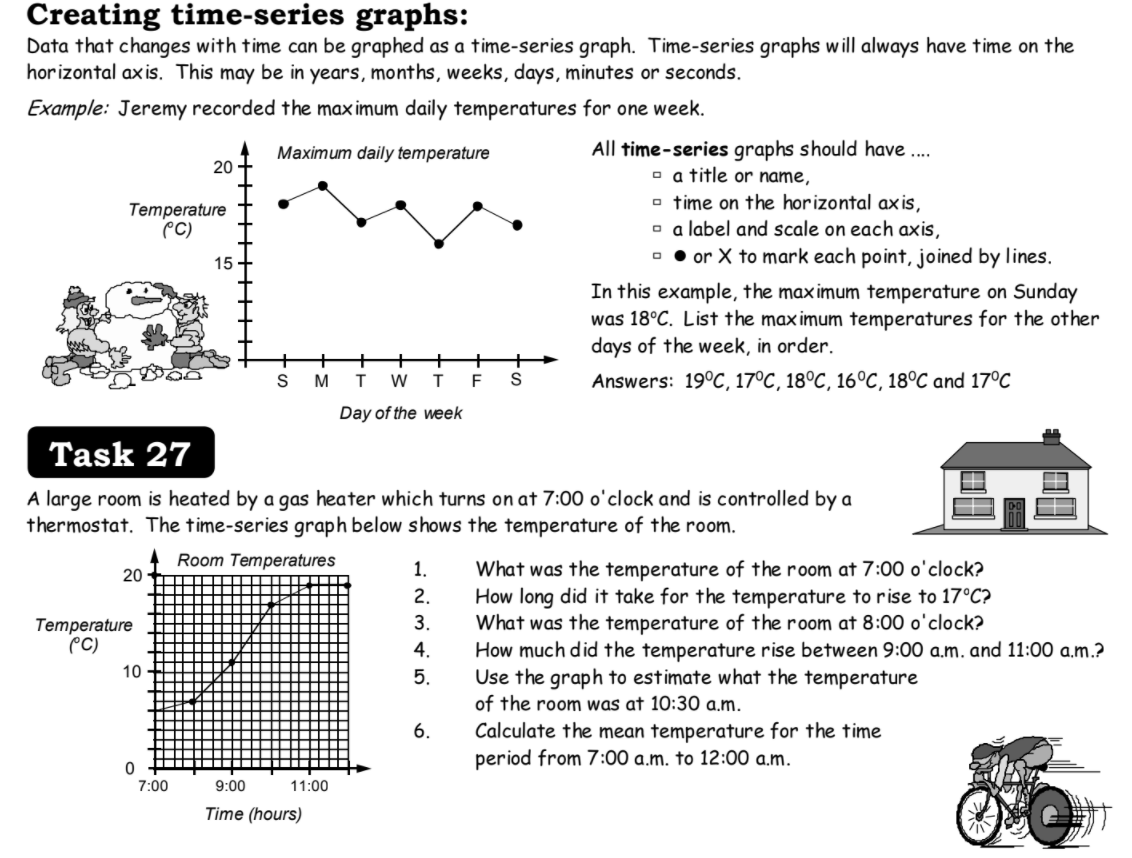
Explore:time-series graph , box & whiskers graph
Thursday: Ludi maths
1. Hei Mahi:
2. Koronga Ako: