
Term 3 Week 10
Section outline
-

EXPLORE / TŪHURA learning intentions:
- We are EXPLORING The Commonwealth by measuring, displaying and mapping the distribution/access to resources, goods, & services
- We are EXPLORING The Commonwealth by investigating the causes of the unequal distribution of resource, goods & services
- We are EXPLORING Economics in Sport by analysing the relationship between access to resources, goods & services and success at the Commonwealth games
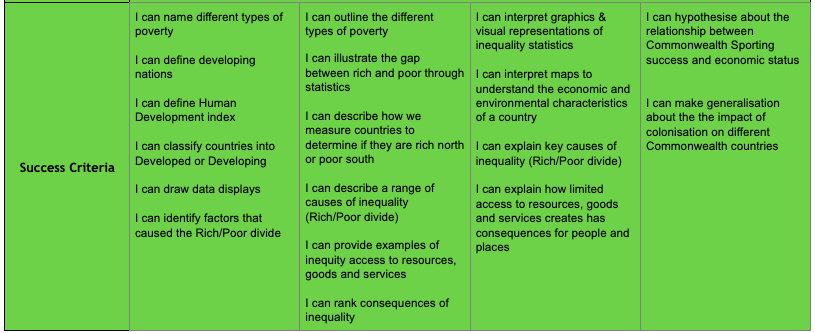
Success Criteria:
Activities:
- Growing Inequality - illustrate the growing gap (inequality - through visual images)and the
consequences of this inequality
(through statistics and visual images)

-
Collaborative activity with Maths - copy of the activity document has been made for you in the Google Classroom
- Drawing my own data display and practicing interpretation
- Testing our Hypothesis: relationship between HDI measures and success at the Commonwealth Games: Success at the Commonwealth Games is determined by the wealth of the country.
Get Ms Lambert to mark the graph you have drawn in your book

Writing Frame - testing hypothesis - conclusion
Success at the Commonwealth Games is determined by the wealth of the country.
Our hypothesis is...... To test this hypothesis we gather data....... By reviewing this data I can conclude...... The data that justifies/supports this conclusion...... However, there is an outliner as...... Therefore in terms of equity (fairness) and the idea of competing on an even playing field........ The wealth of a country......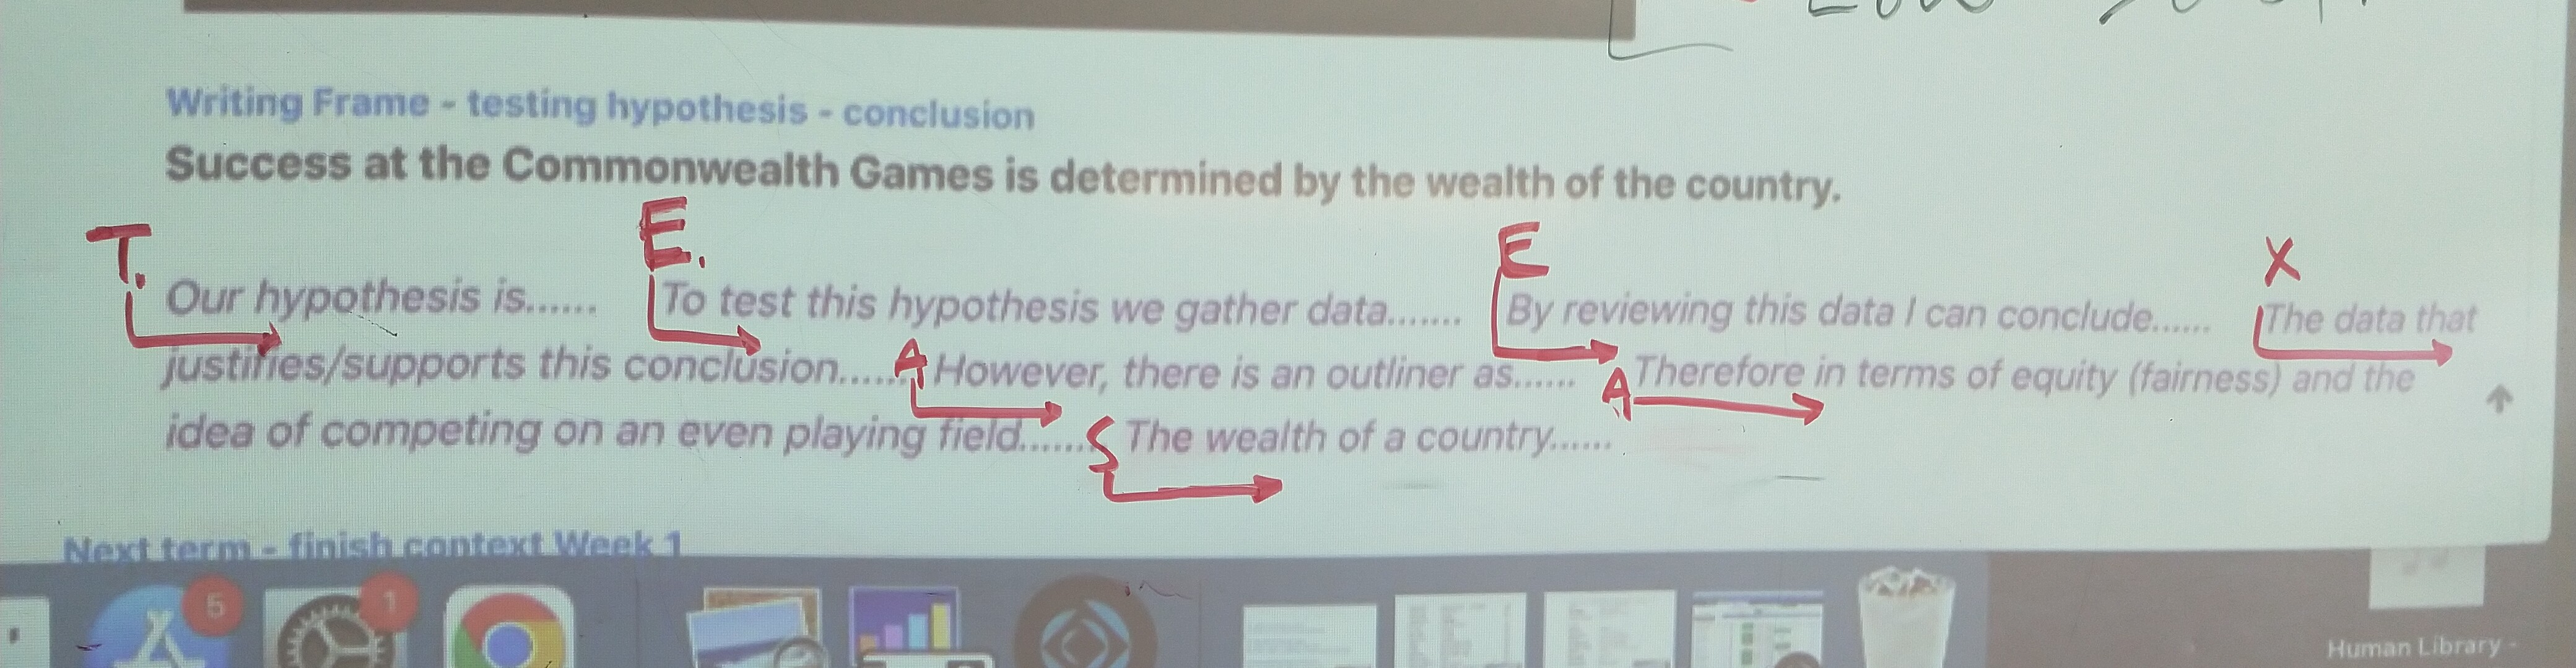
- Learning Guide picture dictation - hand out
- TED Talk activities: WATCH< THINK< DIG DEEPER< DISCUSS
- Globalopoly - Cartoon Interpretation - https://newint.org/features/1994/09/05/cartoon/
- Using Maps to understand causes of unequal distribution and access to resources, goods and services
New Context - The World of Work and Economics week 2 onwards
Further Learning:
Complete this activity at home with a parent/caregiver....
"Compare Your Income'' web tool - https://www.oecd.org/social/inequality-and-poverty.htm
What's your perception of income inequality? The OECD Compare your income tool allows you to see whether your perception is in line with reality. In only a few clicks, you can see where you fit in your country's income distribution. In June 2020, an updated edition was released to explore how people’s perceptions of inequality impact their willingness to support redistribution and to see what areas users would prioritise for public spending.