
Term 3: Week 2
Section outline
-

FOCUS / ARONGA learning intentions:
- We are FOCUSING on identifying discrete versus continuous data
- We are FOCUSING on enhancing data displays using Google Spreadsheet
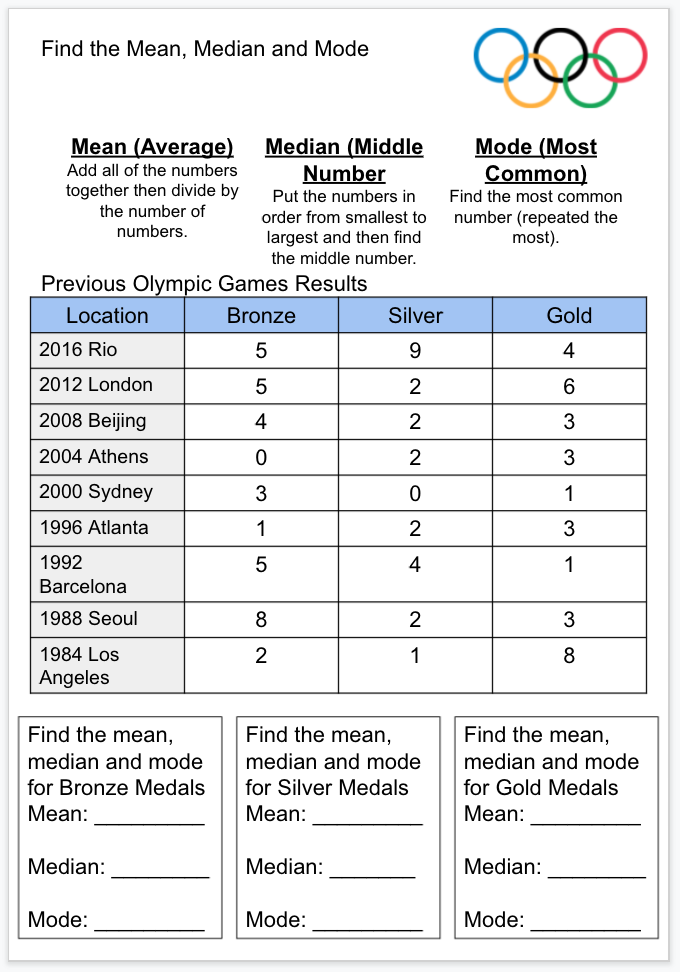
- We are FOCUSING on calculating averages to help examine and discuss results (Mean, Median, Mode & Range)
- We are FOCUSING on describing findings, relationships and trends
Kia ora 7F2,
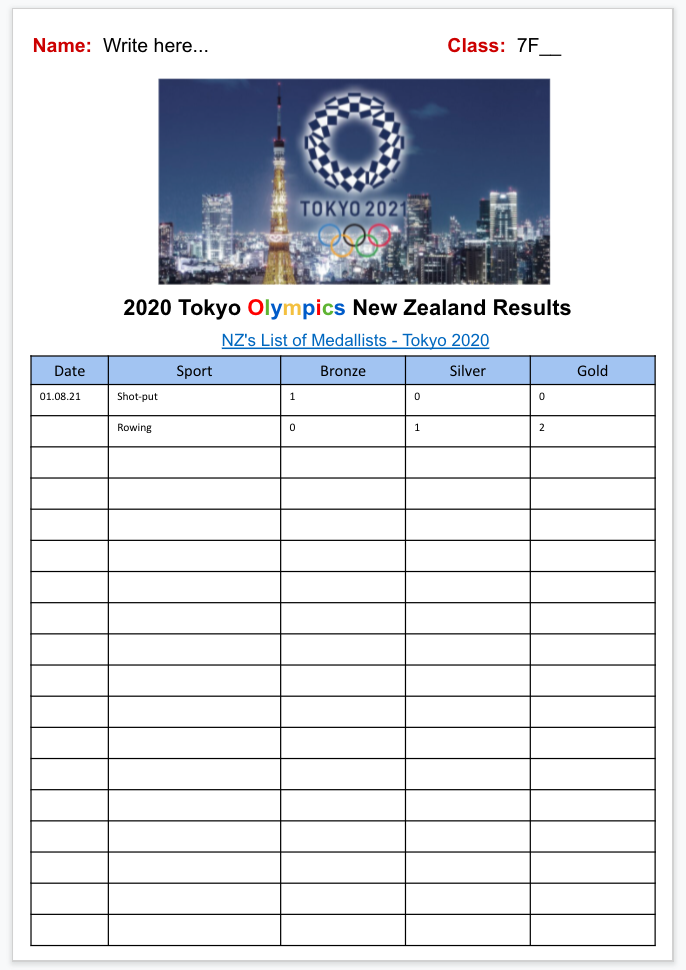
This week we will be exploring Statistics through the context of 'Globe Trotting - The Olympics'.
Authentic Outcomes: Globe-Trotting: The Olympics
Success Criteria: I can...
• Use Google Sheet to display data
• Analyse data using the explore function of Google Sheet
• Discuss data through a written review of 'results', and a 'discussion' and 'conclusion' statement
• Review my 'gaps', barriers and 'next steps' on my mid-year asTTle assessment
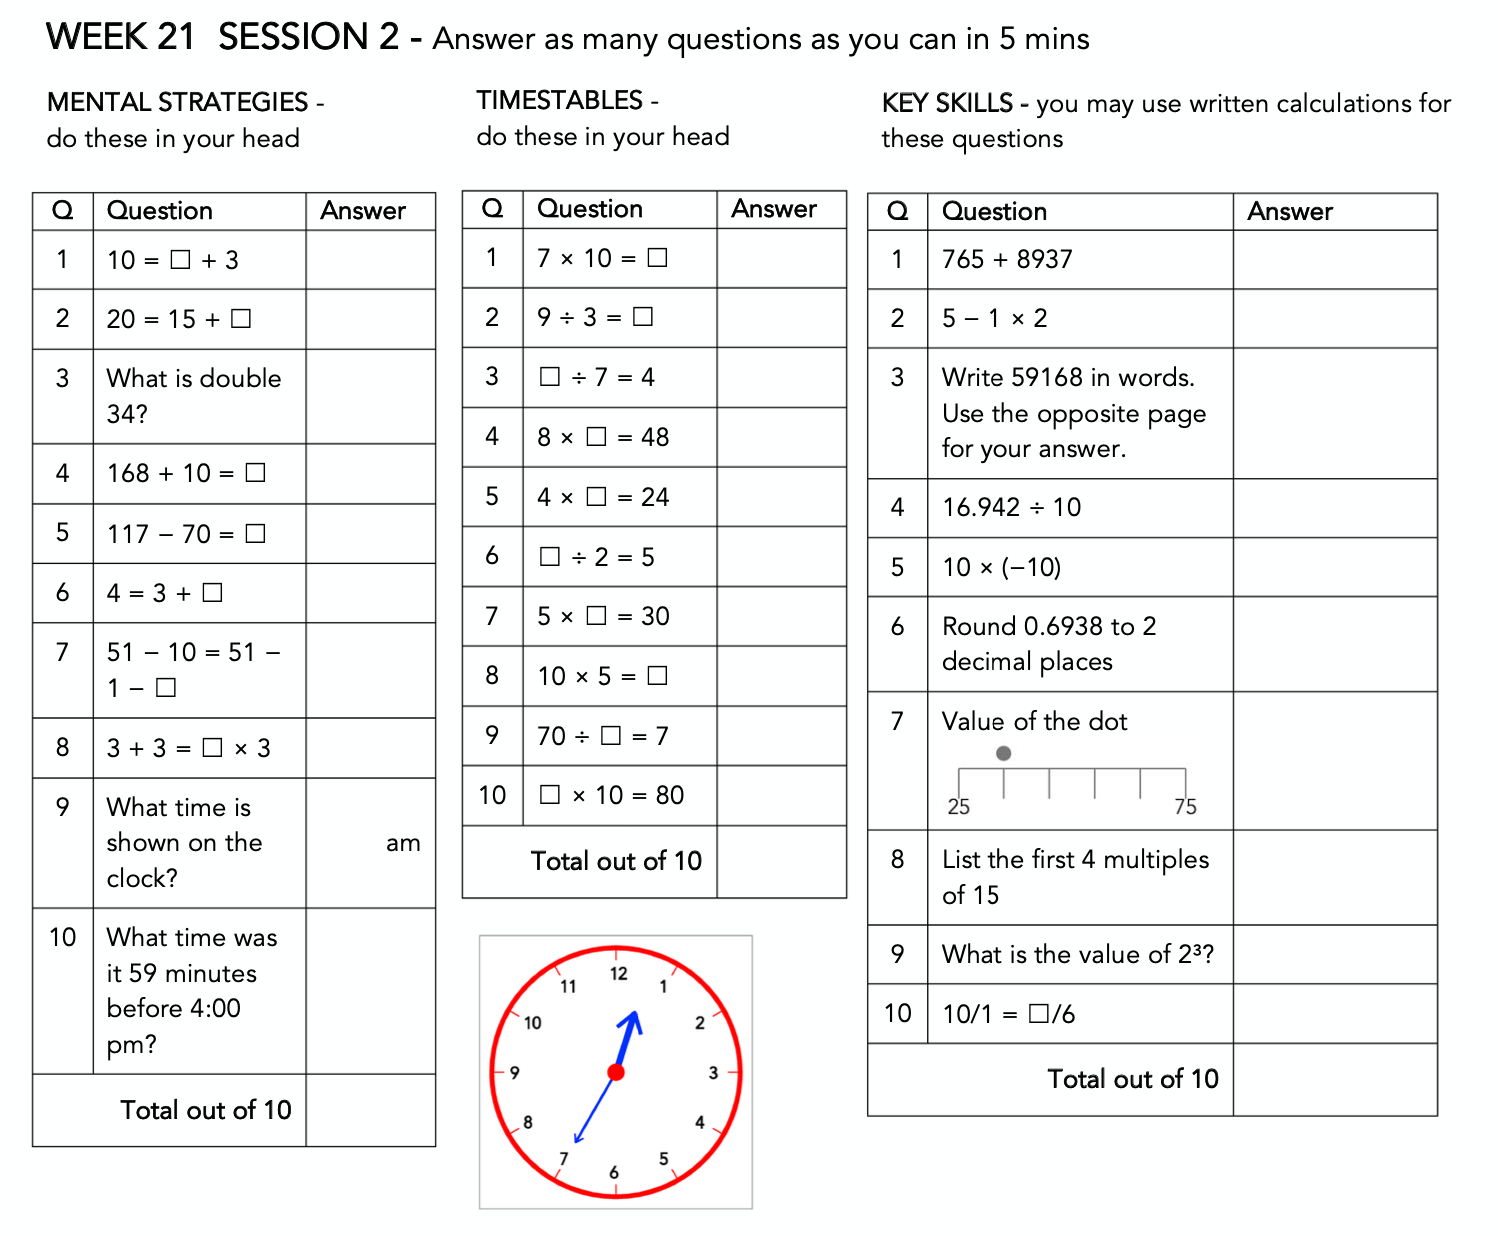
• Recall my basic + , - , x and ➗ factsDo Now:
Students will complete their Numeracy Ninja 'Do Now' Task. Mark as a class.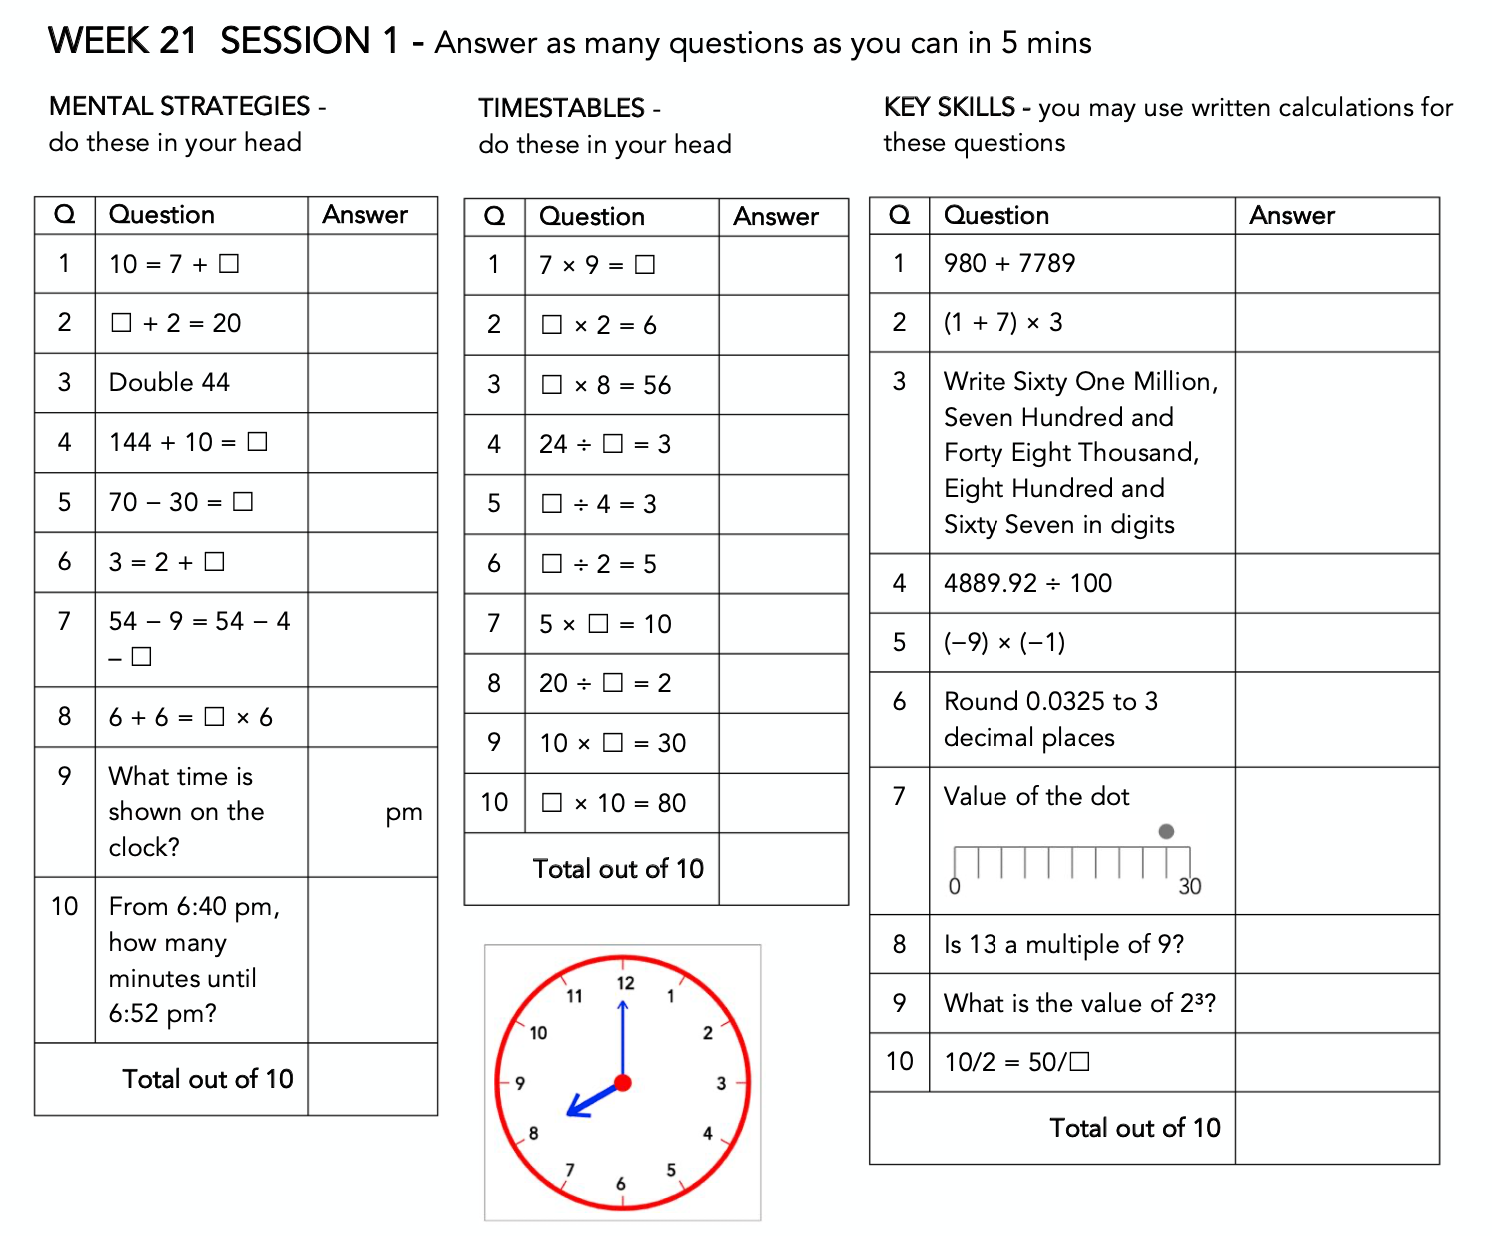
Class Activities:
Statistics (Olympics)
1. Viewing of special Olympic moments from across the globe.
2. Introduction to Olympics research task - statistics.
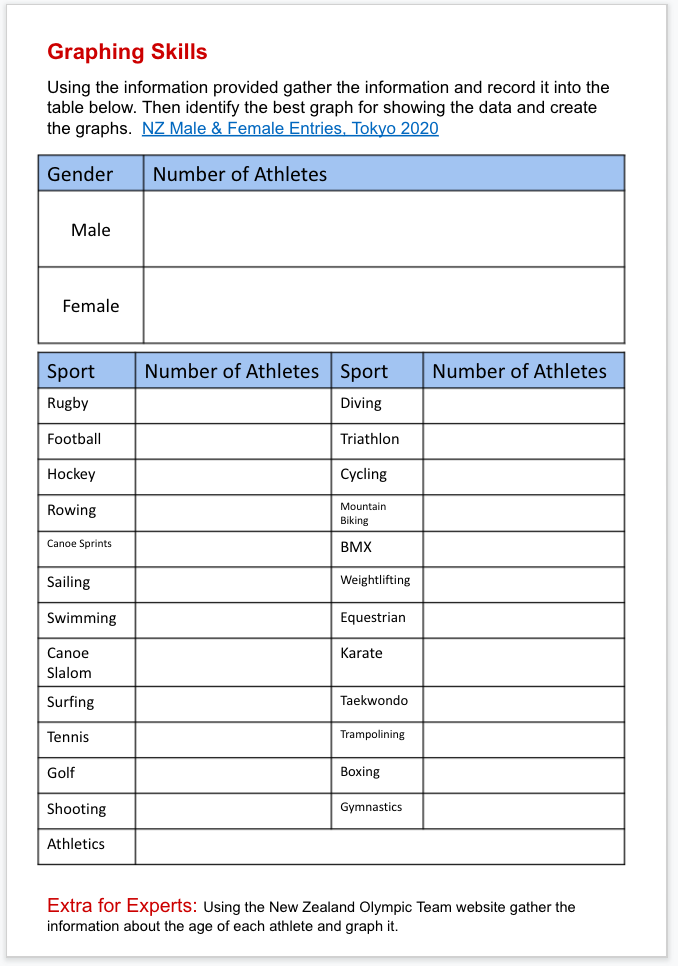
3. Complete research, then the mean, median mode and graphing tasks. Refer below...
4. 'Turn In' for marking.
Homework:
Please complete the Ludi Graphing Task on Google Classroom for your statistics homework this week.