
Term 3: Week 9
Section outline
-
DISTANCE LEARNING WORK - WEEK 9
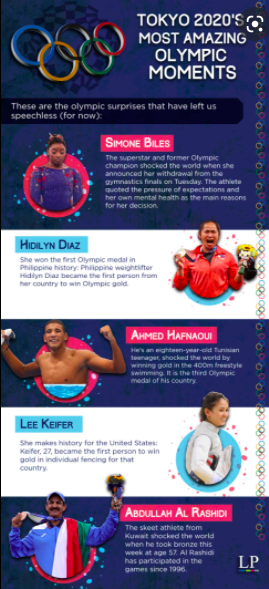
EXAMPLE OF AN INFOGRAPHIC TO GUIDE YOU

MUST DO
- Task : You are required to create an infographic on the Host City of the Olympics. Please include text, pictures and data in the form of creatively planned graphs, (e.g having pie charts in the Olympic Rings)(Statistical, informational & timelines)
1. Before you begin your infographic, you are required to conduct a bit of research on the host city.Here are some suggestions below on what you should include:
2. Include some history of the city (Tokyo) including some past venues of the Olympics in Japan
3. Include some iconic tourist destinations /landmarks and places of cultural significance.
4. Find out facts about Japanese culture.
5. What did it cost Tokyo to host the Olympic events? What opportunities did this event create for Tokyo ?
6. What is the significance of the mascot of the 2020 Olympics?
7. Use the resources below to support you in creating your infographic
Resources: The resources below will support you in creating an infographic
- Read through this slideshow before you begin (https://www.slideshare.net/srichter/teaching-with-infographics-27211531)
- Watch this video (https://www.youtube.com/watch?v=uBBmbdPbfhw) You may need to to copy and paste the URL into your browser.
- Once you have finished, watch the following video on "What Makes a Good Infographic?" (https://www.youtube.com/watch?v=nLxQAa5Sras)
- https://olympics.com/tokyo-2020/en/games/olympics-mascot/