
7M2 Mathematics
Section outline
-
-
-

EXPLORE / TŪHURA learning intentions:
- We are EXPLORING important landmarks in Auckland and wider New Zealand and its significance.
- We are EXPLORING different means of transport to the landmarks so that we can calculate the travel costs.
- We are EXPLORING the cheapest and the most luxury means of transport to various landmarks.
Please note all the activities are in Google classroom.
-

EXPLORE / TŪHURA learning intentions:
- We are EXPLORING numbers in different languages.
- We are EXPLORING different means of transport to the landmarks so that we can calculate the travel costs.
- We are EXPLORING the cheapest and the most luxury means of transport to various landmarks.
Please note all the activities are in Google classroom.
-

FOCUS / ARONGA learning intentions:
- We are FOCUSING on developing different strategies using whole numbers and decimals.
- We are FOCUSING developing algorithms to solve basic maths calculations.
- We are FOCUSING on applying number knowledge to compare various costs.
-
Kia ora class
Success Criteria: I can state place values of digits in whole numbers and decimals.
Activities:
- In google classroom:
- Whole numbers: Answer task# 3,4
Decimals: Answer Task# 5 ,6
Lesson 2: Adding and Subtracting Decimal numbers: task # 8,9
Homework:
Maths Buddy -
Planning for next two weeks.

PLAN & DO / WHAKAMAHI learning intentions:
- We are PLANNING to apply number knowledge so that we can calculate the budget and luxury means of transport to travel to chosen destinations.
Kia ora...
Success Criteria: I can/have...
- Add and Subtract Decimal numbers
- Multiply and divide decimal numbers
- solve problems involving decimals such as money.
Activities:
- All activities are in Google classroom.
- Answer tasks from AWS Number Level 3.
Homework:
Maths buddy -
-
-
-
-
-
-
Kia ora class
Plan for Weeks 10 and 11.
Success Criteria: I can/have...
- . Writing fractions in words
2. Finding fractions of amounts.
1. DO Now- 10 mins: Fraction matcher-start with level 2...
Drag the shape in one of the containers on the left and the fraction on the right one.
Check your answer. good luck
2.
Activities:
- Open file #AWS Level 3.pdf"
2. Group Toru: Answer Tasks 23,24 odd number only then task 26Homework:
Write here maths Buddy - . Writing fractions in words
-
-
-
Kia ora class
Welcome to Term 2
Success Criteria: I can/have...
- draw and name Polygons
- To describe the features of 2-dimensional and 3-dimensional objects, using the language of Geometry.
:To design and make containers to specified requirements
Activities:
- In Google classroom: Geometry L3
- Answer tasks 1,3,4,5,6
Homework:
Maths BuddyEXPLORE / TŪHURA learning intentions:
- We are EXPLORING shapes and patterns in Constellations, Astronomy
- We are EXPLORING Matariki stars to investigate geometry.
- We are EXPLORING astronomy to investigate angles.
-
Kia ora class
Success Criteria: I can/have...
- Name Polygons
- I can describe positions
Activities:
- In Google classroom
Homework:
maths Buddy -
Kia ora 7M2
Week 3
Success Criteria: I can/have...
1. Reflection
Answer Task#19. Geometry L3
2. Rotation
Answer task 20
3. Translation
Answer Task 21
Group Toru: Open L4: Answer Tasks # 19,20,21
HW: MB
Activities:
- Write here
- Write here
Homework:
Write here... -
Week 4: Tesselations
Answer task #22
Enlargements. Task # 24 -
Kia ora class
Work for Weeks 6 and 7
Topic: Patterns and Algebra
Success Criteria: I can/have...
- We can explore patterns in Algebra
Activities:
- In Google classroom
Homework:
Maths Buddy -
Welcome to my Maths and stats class. Let's call my way of teaching as joining the dots....
My name is Mr. Hishey. Maths is all about trying to figure out how one step leads to another.
My job is to make you ask questions so you can then figure out the answers step by step.
It is important to show your understanding of maths step by step, so showing your working out, the method is super important.
Learning is a process. We learn, we get tested so that we remember what we learnt, then we build on our learning, just like a house is built.
Words you should learn the meaning of:
Axis, correlation, variable, constant, equation, integers, negative gradient, positive gradient, linear, coordinates, parallel lines, straight line, line segment, y intercept, point of origin, hypotenuse, angles, degrees and types of angles, triangles, similar triangles, ratio, proportion, fraction, equivalent fractions, directions, latitudes, longitudes, equator, prime meridian, 24 hour clock, unit rate, HCF to simplify fractions, LCM to find common denominators to add or sutract fractions.
Must know: Use of protractor, ruler, compass, Timestable, Basic Facts.
Learning intentions for next 5 weeks:
STEP BY STEP on graph paper, pencil, super neat. Highlight each line once you have passed the test.
WEEK 6.
- . Drawing the number line accurately as the foundation for further learning on graph paper
- Using the number line to recall (<) less than, (>) greater than
- Using the number line to understand integers
- 4 application of integers
- Using the number lines to understand x axis ( independent variable) and y axis ( dependent variable)
- Using the x and y axis to understand angles, parallel lines, gradient, coordinates
WEEK 7
- Drawing when x =0 it becomes the y axis, when y=0 it becomes the x axis
- Using x = 0, y= 0 as the point of origin
- Understand when x=0, y = C. ( y intercept) If y=2 then the x axis must move 2 units up to make x=0, y=0 as the new point of origin. Students will begin to work with C a given number, not a variable.
- Using gradient (positive) as hypotenuse of right angled triangles
WEEK 8
- Using right angled triangles of common hypotenuse (gradient) to form similar triangles
- applying equivalent fractions to calculate unknown side
- Creating a rule for similar triangles
- Using similar triangles for enlargement, translation, ratio and proportion
- Using similar triangles to understand unit rate, height /base ( rise/run =m)
- Using unit rate as m to calculate a change in x to figure out y
- Figuring out what the hypotenuse (Gradient) represents in a graph and its use
WEEK 9
- figuring out the word meaning correlation and its use.
- Using table method for x and y
- Using an equation from the table method y = x, or y = something an x
- Using the right angle triangle with gradient as hypoteneuse to form an equation y =?
- Finally, create a general rule ( equation) for the straight line (gradient) on a graph.
WEEK 10
- Use right angle triangle for pythagoras rule.
- Trig functions, for a given angle the ratio of the lengths of sides are fixed so rules can be applied.
- Transition from linear to quadratic function. When y=0, x= a, x=b from x^2.
- Geogprahy: Use x, y axis as equator and Prime Meridian, lats and longs, time difference, GPS, seasons, location, bearings, protractor, cardinal directions, compass directions.
- Science experiments: Independent and dependent variables
Success Criteria: Explore : What I need to know to solve problems in context - I can go to the next step of my learning from the previous week when I can successfully show my previous learning steps with reasoning.
Focus: Now that I have my maths and stats knowledge from each week: I can create strategies to solve maths and stast problems in context in a meaningful way I can understand.
Plan and do: I can ask questions, plan and solve problems with each week's learning across the curriculum applying my maths and stats knowledge.
Activities:
- Introduction and class management and lesson management system
- whole class teaching; ref slides.
- test on lesson 10 mins. Not successful? ask a friend. Do test again. Not clear? Arrange Google meet with me.
- Mathsbuddy check to support learning not as HW to be completed.
- Learing intentions list: Where am I? Highlight ones you have passed. Check next slides for tasks.
- Sit on tables that have common tasks on slides.
Home learning:
Complete class work, copy claaswork to exercise book and any mathsbuddy /EP task linked to classwork -
Kia ora class
Topic: Statistics
Success Criteria: I can/have...
- We can explore statistics
Activities:
- Write here
- Write here
Homework:
-
Term 3 Week 1
Wecome back Y7M2. Hope you had a great term break.
Learning intentions for week 1.
We are learning to:
- connect number patterns and use tables, graphs, and diagrams to find relationships between successive number. L3.
- Use graphs, tables, and rules to describe linear relationships found in number L4.
- relate tables, graphs, and equations to linear relationships found in number. L5.
- relate rate of change to the gradient of a graph. L6.
Revisit last term's work by Mr. Hishey by completing Kahoot and Mathsbuddy question bank.
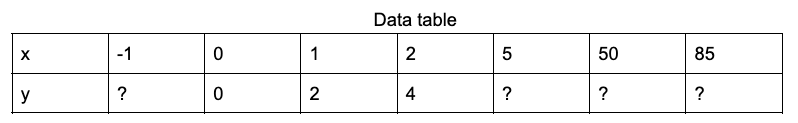
Q1. a) Look for a pattern in the number sequence.
b) Then complete the data table.
c) Plot the coordinates on a graph paper using x, y axis and joint the coordinates with a straignt line
d) Calculate the unit rate= Draw a straight line from x=1 up to the gradient. This standing line is called the Rise. Draw this on the graph. Use the y axis to measure this standing line. Now divide the rise with the measure of x which is x=1. (sleeping line or Run). The answer you get is called the unit rate.eg. One apple costs 2 dollars. That cost (y axis) of one apple (x axis) is called the unit rate. When you know the cost of one then you can calculate the cost of many. So, m is the cost of 1. times x is the cost of many. and y is the total cost, any added cost is c. So, Y = m times x+c.
e) When x= 0, y = 0. What is this corodinate point called? Y has been given a special letter here, what letter is it and what does it stand for?
f) From your graph create a rule for y =m time x +c.
g) Use your rule to solve, when f(x) = 85, y =?
h) confirm the graph is correct using your rule for y=mx+c.
i) Identify the idependent/dependent variables? explain.
j) Is the gradient positive/negative? Why? explain.
k) Explain c in y=mx+c. Why is c important?
Tue: Complete Q1 upto d).
Wed: Complete from e) to g).
Fri: Complete h) to k). Done!
-
EXPLORE / TŪHURA learning intentions:
- We are EXPLORING... to investigate food/drink labels
- We are EXPLORING... to display data extracted from food/drink labels
- We are EXPLORING... to analyse daily intake percentages
Success Criteria: I can/have...- We can analyse graphs and visual displays of data to form opinions on food/drink labels and the health industry at large
- We can extract data from food/drink labels
- We can represent data from food/drink labels into tables and pie charts
Activities:
- In Google classroom
Homework:
Activities introduced in class -
EXPLORE / TŪHURA learning intentions:
- We are EXPLORING... to investigate food/drink labels
- We are EXPLORING... to display data extracted from food/drink labels
- We are EXPLORING... to analyse daily intake percentages
Success Criteria: I can/have...- We can analyse ingredients labels, by categorising and grouping specific ingredients and measuring the amounts and proportions per serving
- We can extract data from food/drink labels
- We can represent data from food/drink labels into tables and pie charts
- We can identify and describe a problem and put it into a question in order to guide our inquiry
Activities:
- "Ingredient analysis" pie graphs and data tables document
- "Buyer Beware Inquiry" slides
- Ludi basic facts work
Homework:
1. 20 min of Ludi "Playground"
2. Mathsbuddy tasks
-
EXPLORE / TŪHURA learning intentions:
- We are EXPLORING... to classify the different ingredients in food/drinks
- We are EXPLORING... to analyse these ingredients and determine how nutritious they are
- We are EXPLORING... to display our findings in a pie graph
Success Criteria: I can/have...- analyse ingredients labels, by categorising specific ingredients
- represent data from food/drink labels into tables and pie charts
- identify and describe a problem and put it into a question in order to guide our inquiry
- apply what I have learned from analysing and collecting data to analyse my own Ludi results and use it to make a goal for my basic facts work
Activities:
- "Ingredient analysis" pie graphs and data tables document
- "Ludi Analysis"
- Ludi basic facts work
Homework:
1. 20 min of Ludi "Playground"
2. Friday Mathsbuddy tasks
3. All tasks not completed in class -
EXPLORE / TŪHURA learning intentions:
- We are EXPLORING... to classify the different ingredients in food/drinks
- We are EXPLORING... to analyse these ingredients and determine how nutritious they are
- We are EXPLORING... to display our findings in a pie graph
Success Criteria: I can/have...- analyse ingredients labels, by categorising specific ingredients
- represent data from food/drink labels into tables and pie charts
- convert decimals, fractions and percentages
Activities:
- "Ingredient analysis" pie graphs and data tables document
- Education Perfect task
- Ludi basic facts work
Homework:
1. 20 min of Ludi "Playground"
2. Friday Mathsbuddy tasks
3. All tasks not completed in class
-
EXPLORE / TŪHURA learning intentions:
- We are EXPLORING... to classify the different ingredients in food/drinks
- We are EXPLORING... to analyse these ingredients and determine how nutritious they are
- We are EXPLORING... to display our findings in a pie graph
Success Criteria: I can/have...- analyse ingredients labels, by categorising specific ingredients
- represent data from food/drink labels into tables and pie charts
- convert decimals, fractions and percentages
- display data using a box-and-whisker plot
Activities:
- "Ingredient analysis" pie graphs and data tables document
- Google classroom box-and-whisker plot activity
- term 3 reflection
- Ludi basic facts work
Homework:
1. 20 min of Ludi "Playground"
2. Friday Mathsbuddy tasks
3. All tasks not completed in class
-
PLAN & DO / WHAKAMAHI learning intentions:
- We are PLANNING... to use our mathematical skills so that we can make better choices as consumers.
- We are PLANNING... to construct pie graphs that represent our data collected from our nutrition science experiment
- We are PLANNING... to conduct a statistical enquiry on a chosen breakfast food item
Success Criteria: I can/have...- analyse ingredients labels, by categorising specific ingredients
- represent data from food/drink labels into tables and pie charts
- convert decimals, fractions and percentages
Activities:
- Maths/English/PE/Science assessment on Mission Heights Online
- Education Perfect task
- Ludi basic facts work
Homework:
1. 20 min of Ludi "Playground"
2. Friday Mathsbuddy tasks
3. Assessment
-
PLAN & DO / WHAKAMAHI learning intentions:
- We are PLANNING... to use our mathematical skills so that we can make better choices as consumers.
- We are PLANNING... to construct pie graphs that represent our data collected from our nutrition science experiment
- We are PLANNING... to conduct a statistical enquiry on a chosen breakfast food item
Success Criteria: I can/have... - analyse ingredients labels, by categorising specific ingredients
- represent data from food/drink labels into tables and pie charts
- convert decimals, fractions and percentages
Activities:
- Maths/English/PE/Science assessment on Mission Heights Online
- Education Perfect task
- Ludi basic facts work
Homework:
1. 20 min of Ludi "Playground"
2. Friday Mathsbuddy tasks
3. Assessment
-
PLAN & DO / WHAKAMAHI learning intentions:
- We are PLANNING... to use our mathematical skills so that we can make better choices as consumers.
- We are PLANNING... to construct pie graphs that represent our data collected from our nutrition science experiment
- We are PLANNING... to conduct a statistical enquiry on a chosen breakfast food item
Success Criteria: I can/have...- analyse ingredients labels, by categorising specific ingredients
- represent data from food/drink labels into tables and pie charts
- convert decimals, fractions and percentages
Activities:
- Maths/English/PE/Science assessment on Mission Heights Online
- Education Perfect task
- Ludi basic facts work
Homework:
1. 20 min of Ludi "Playground"
2. Friday Mathsbuddy tasks
3. Assessment
-
EXPLORE / TŪHURA learning intentions:
- We are EXPLORING... to discover how ratios exist in the world around us
- We are EXPLORING... to measure and calculate scales used for our drawings
- We are EXPLORING... to display measurements from the 3D world in our 2D drawings
Success Criteria: I can/have...
- identify equivalent ratios
- identify ratios found in the world around me
- use the golden ratio to explore proportions of images
- draw an image using the golden ratio
Activities:
- Ludi number practice
- Golden Ratio Group Inquiry
- Golden Ratio Drawing
Homework:
1. Weekly MathsBuddy Task
2. New Zealand Textbook Practice questions not completed in class
-
EXPLORE / TŪHURA learning intentions:
- We are EXPLORING... to discover how ratios exist in the world around us
- We are EXPLORING... to measure and calculate scales used for our drawings
- We are EXPLORING... to display measurements from the 3D world in our 2D drawings
Success Criteria: I can/have...
- use measuring tools to collect measurements
- convert cm,mm,m
- identify an appropriate scale for our drawing base don our measurements
- draw a skeleton in proportion my own measurements
Activities:
- Maths-a-thon MB Task
- Skeleton Drawing Rough Draft
- Collect measurements and convert (mm,cm,m)
- How to Prepare for E-astelle
Homework:
1. Weekly MathsBuddy Task
2. E-asTTle Practice Tests
-
EXPLORE / TŪHURA learning intentions:
- We are EXPLORING... to discover how ratios exist in the world around us
- We are EXPLORING... to measure and calculate scales used for our drawings
- We are EXPLORING... to display measurements from the 3D world in our 2D drawings
Success Criteria: I can/have...- use measuring tools to collect measurements
- convert cm,mm,m
- identify an appropriate scale for our drawing base don our measurements
- draw a skeleton in proportion my own measurements
Activities:
- Maths-a-thon MB Task
- Skeleton Drawing Rough Draft
- Collect measurements and convert (mm,cm,m)
- How to Prepare for E-astelle
Homework:
1. Weekly MathsBuddy Task
2. E-asTTle Practice Tests
-
EXPLORE / TŪHURA learning intentions:
- We are EXPLORING... to discover how ratios exist in the world around us
- We are EXPLORING... to measure and calculate scales used for our drawings
- We are EXPLORING... to display measurements from the 3D world in our 2D drawings