
Term 2, Week 10
Section outline
-

EXPLORE / TŪHURA learning intentions:
- We are EXPLORING number operations in context to support Stage One of our MHJC Numeracy Certificate
- We are EXPLORING angles and their properties
- We are EXPLORING, selecting and defining angle types, and classifying angles
- We are EXPLORING how to calculate angles on a straight line
- We are EXPLORING 3D shapes and constructing nets using geometric equipment
- We are MEASURING and converting mm to centimetres to meters and kilometres
- We are CALCULATING areas of squares and triangles
- We are CALCULATING volumes of cubes and rectangles
- We are DISCOVERING which graph is best to display different STEM FAIR data sets

PLAN & DO / WHAKAMAHI learning intentions:
- We are APPLYING number operations to complete Stage One of our Numeracy Certificate
Authentic Outcomes: Science Fair and ‘Taonga of Aotearoa’ weaving/print-making exhibition.
Theme: The importance of land/sustainability
Whakatauki: "Whatungarongaro te tangata, toitū te whenua."
Metaphorical: As people disappear from sight, the land remains.
Literal: This whakatauki speaks to the importance and permanence of land. While people come and go, the land remains. As humans we rely on the land. We must think long-term and see the big picture to ensure the sustainability of the land.Success Criteria: I can...
Measurement & Geometry
• Identify and convert between units of measurement.
• Calculate perimeter, area and volume.
• Measure an angle using a protractor (sharp shoot over the vertex, ensure the horizontal line of the protractor is aligned correctly, read from zero)
• Name the types and properties of acute, right, obtuse & reflex angles
• Name types of triangles
• Name 3D shapes
• Identify and convert units of length (mm, cm, m & km), mass (mg, g, kg, T) and capacity (mL, L, kL)Statistics
• Organise data onto a frequency table
• Identify the 'x' and 'y' axis to accurately plot data onto graphs
• Apply the TAILS acronym to display data effectively
• Interpret graphs (line graphs, bar and dot plots)
• Calculate averages (mean, median, mode and range)
Class Activities: Statistics
Kia ora everyone,
This week, we will explore statistics. We will learn organising data onto a frequency table.
Session 1: Complete unfinished work
Session 2: Dot plot
Session 3: Stem-and-lead plot
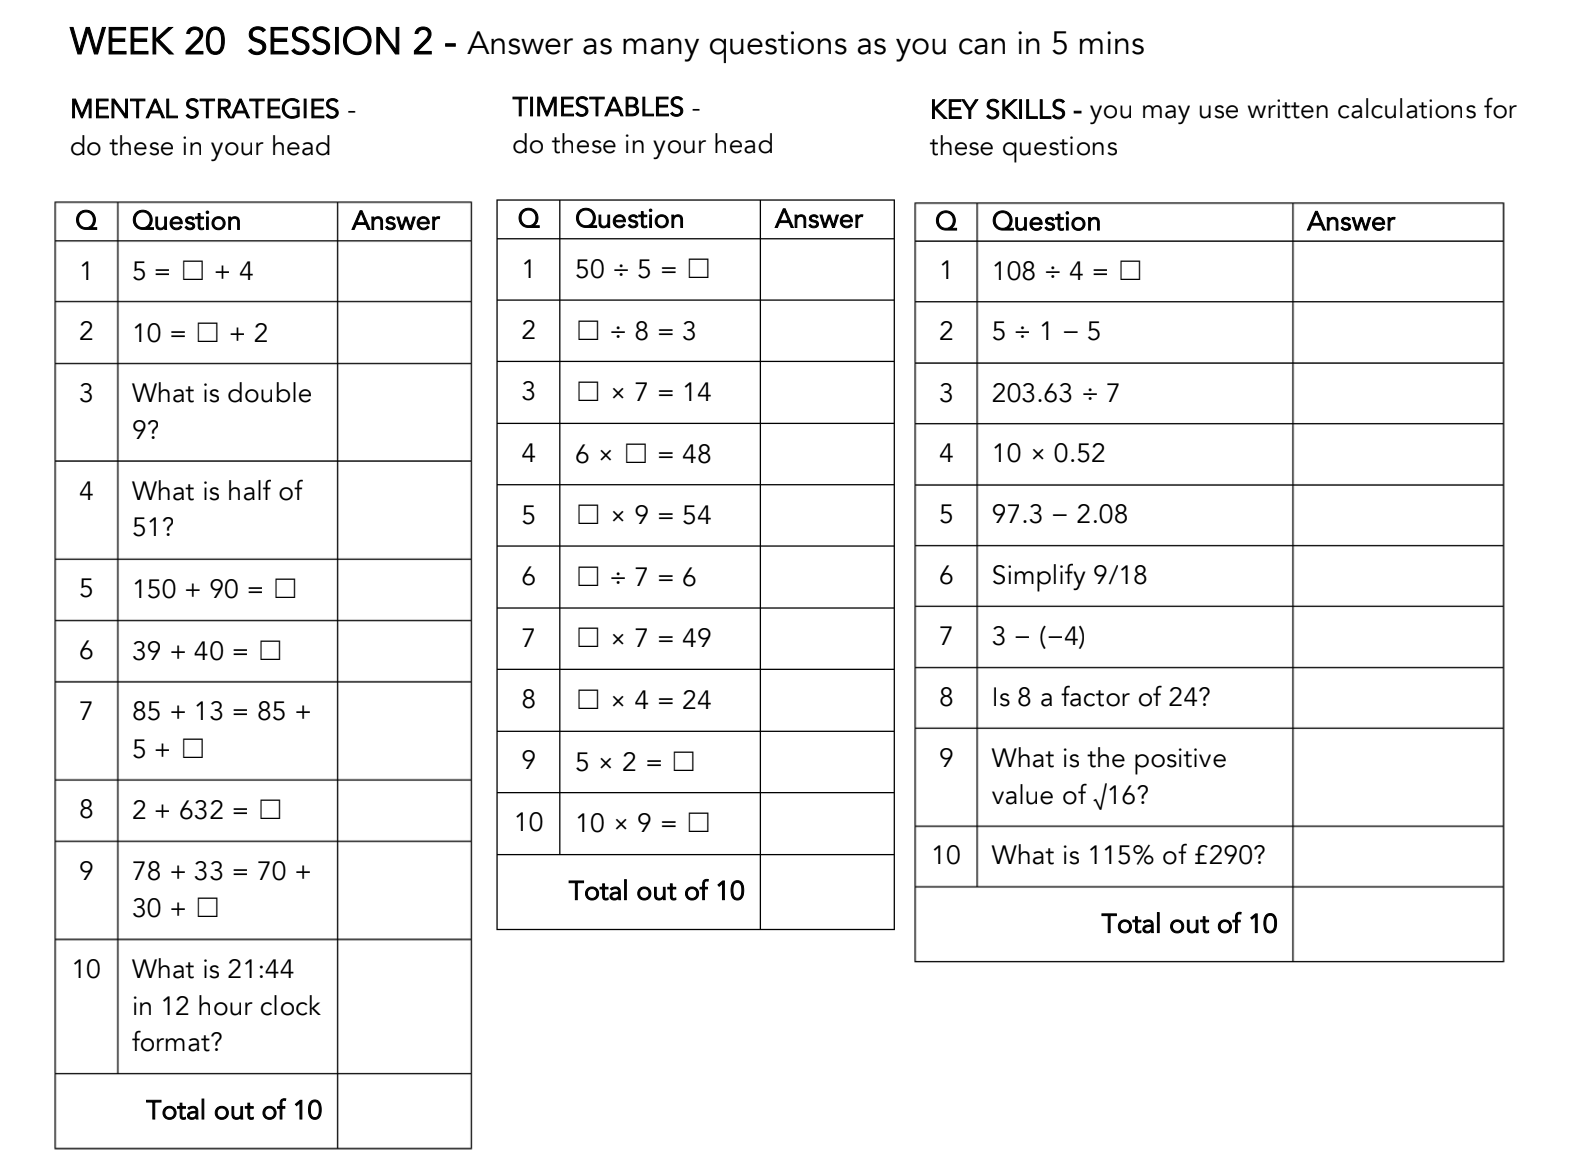
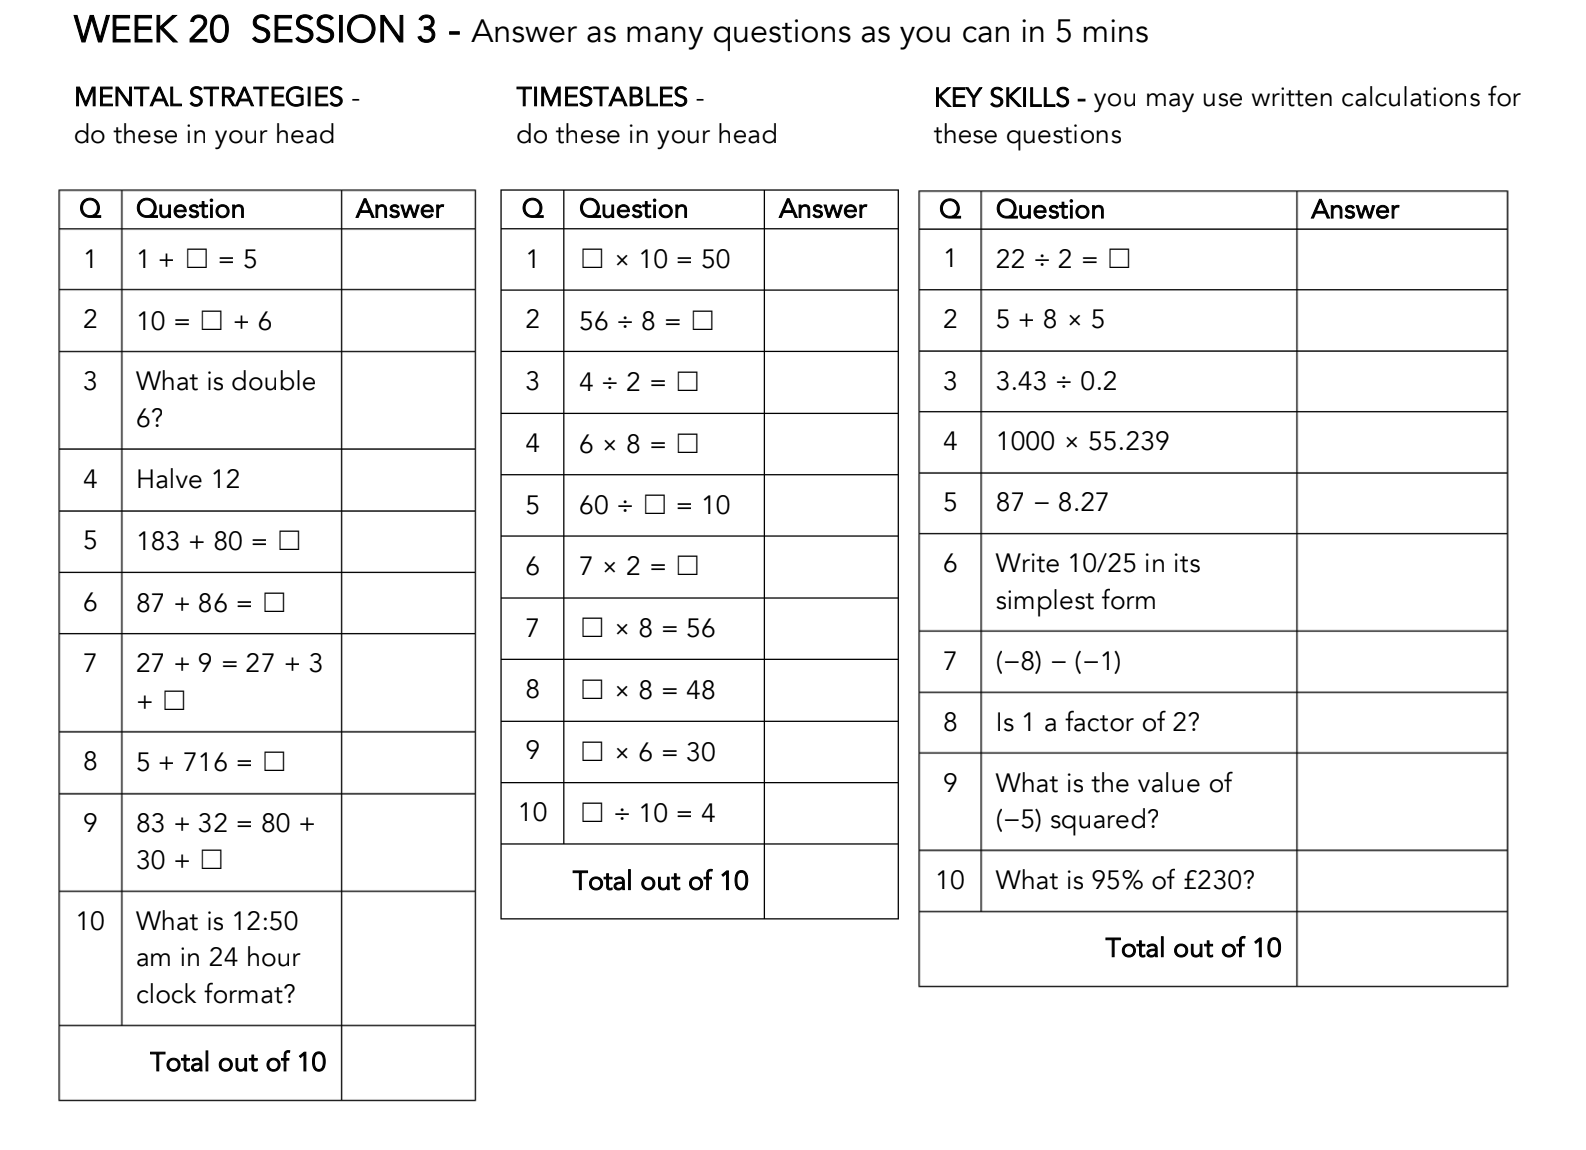
1. Complete Numeracy Ninja Do Now challenge.
2. Record and underline the short date with a ruler and record the session's Learning Intention at the front of your maths exercise books. Please write in pencil, and rule/underline and mark with red pen.
3. Ensure to draw the red line, write date and activity title.
4. Ensure to write WALT.
5. After teacher's modeling, start the activity.
Fast finishers can work on their Maths Buddy reinforcement activities.
6. Mark exercise bookwork, in groups.
7. Reflect on your understanding and effort, in your ' Maths Evaluation '.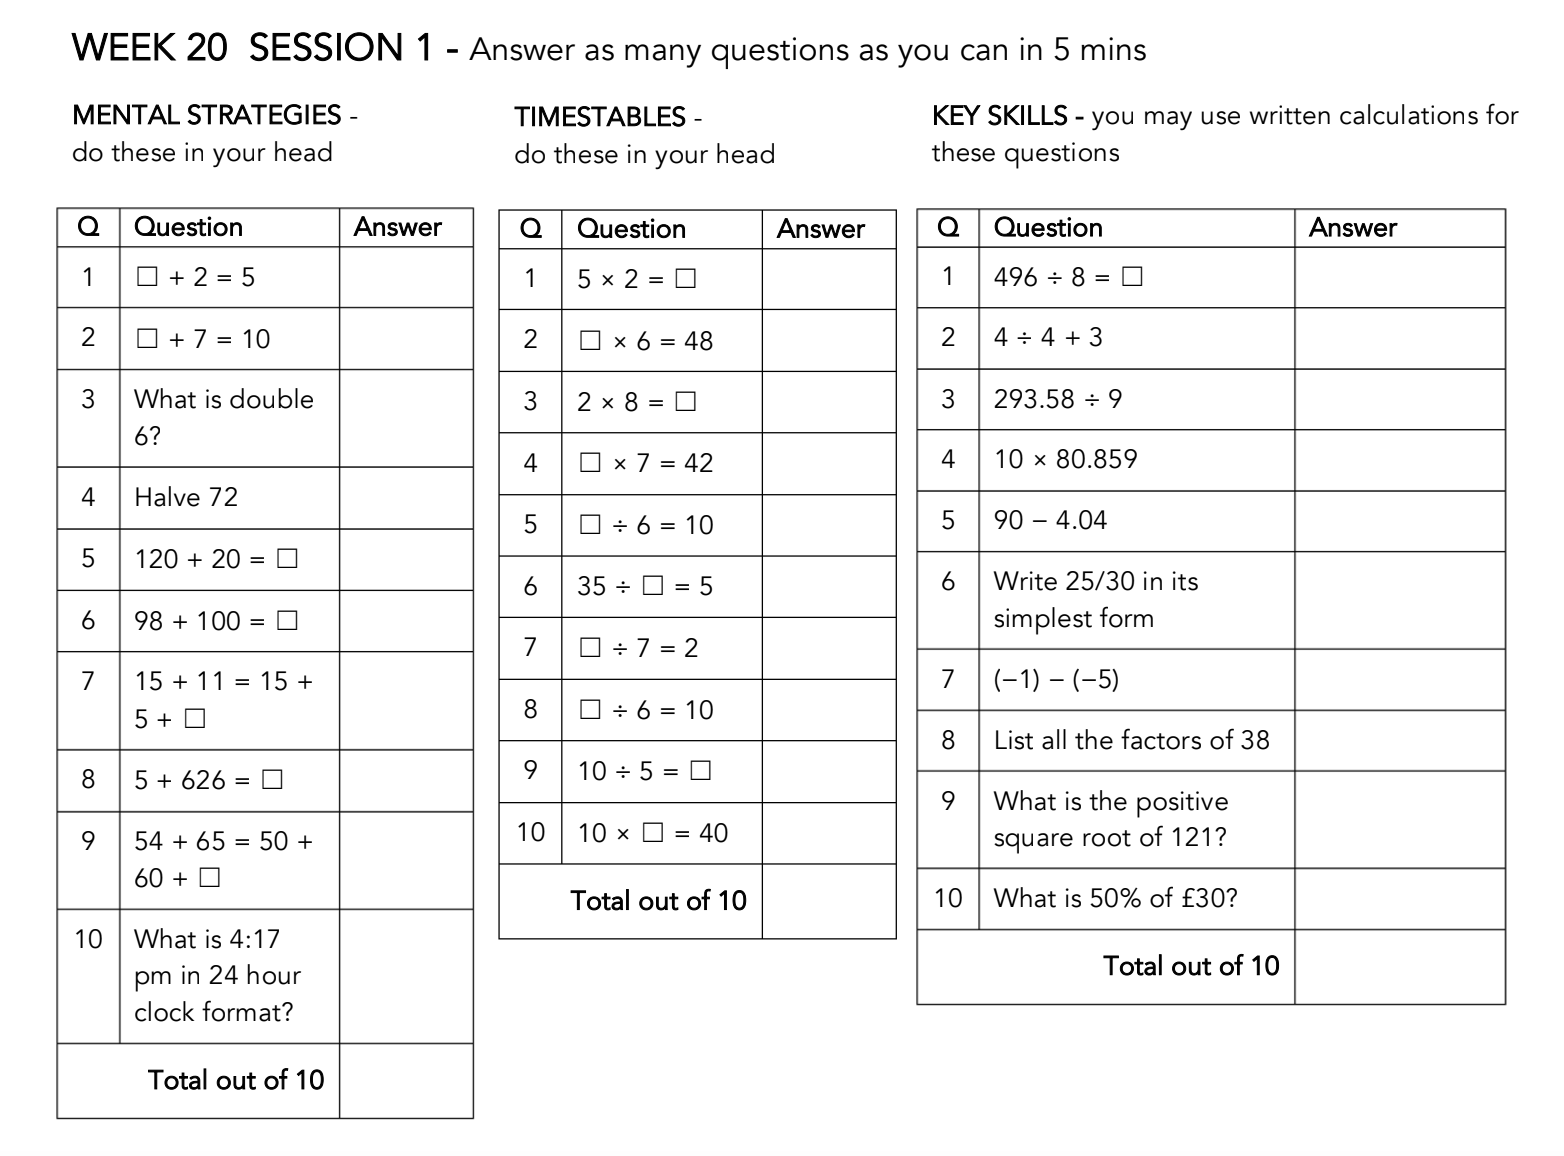
Homework:
Maths Buddy is your priority for your at-home practice. Please complete your set homework tasks by Friday at 9:30am (Forest's homework routine has now changed to 'Due on Fridays & re-issued on Fridays' to allow you more time). If you have completed your assigned activities please do extra practice on your 'Ludi' timetables programme and complete your Numeracy Certificate tasks.
Here's my suggestion re: how to effectively distribute your weekly homework responsibilities this week...
Mondays: 2 x Maths Buddy Tasks and 1 x See Reader
Tuesdays: 2 x Maths Buddy Tasks and 1 x See Reader
Wednesdays: 2 x Maths Buddy Tasks, 1 x See Reader during Wananga Wednesday and 1 x iBalance plus 1 x Read Around at home
Thursdays: 2 x Maths Buddy Task, 1 x See Reader