
13 March - 19 March
Section outline
-
KSession

EXPLORE / TŪHURA learning intentions:
- We are EXPLORING...the interpretation of statistical information and Reports
- We are EXPLORING...working with data and displaying of data
- We are EXPLORING...the statistical inquiry cycle.
Hei Mahi:
You have 5 minutes to complete 10 Questions. Focus on the strategies you will use to solve the problems.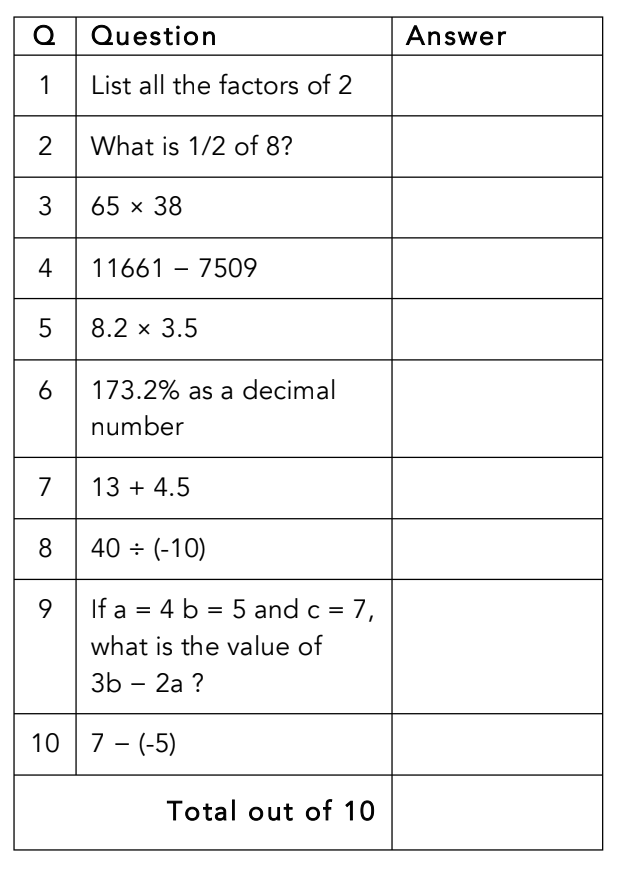
Koronga ako:
Be able to draw, read and interpret a Bar Graph
Classwork:
Work in your group and complete the questions on Bar Graphs.
Session 2:
Hei Mahi:
LUDI : Challenge yourself!!!
Koronga Ako:
1. Be able to read, understand and analyse Bar Graphs and Histograms.
2. Be able to read, understand and draw Box and Whiskers graphs