
6 March - 12 March
Section outline
-
Session

EXPLORE / TŪHURA learning intentions:
- We are EXPLORING...the interpretation of statistical information and Reports
- We are EXPLORING...working with data and displaying of data
- We are EXPLORING...the statistical inquiry cycle.
Hei Mahi:
You have 5 minutes to complete 10 Questions. Focus on the strategies you will use to solve the problems.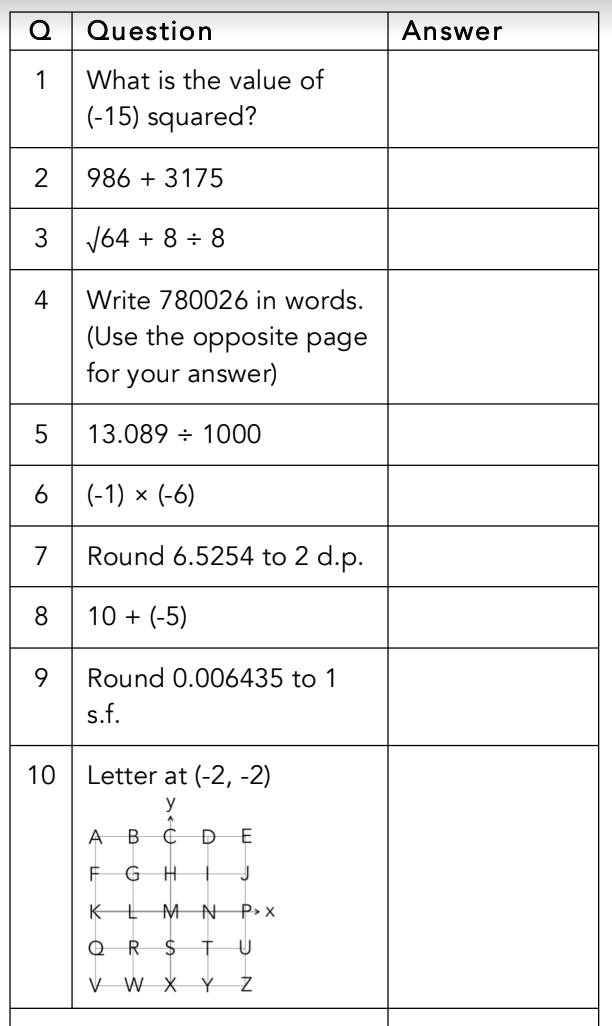
Mark your answers on the Frequency Table and Stem and Leaf Plot.
Koronga Ako:
Be able to do and analyse a DOT PLOT using statistical data
Classwork:
Work in your Math groups, discuss the information and answer the questions in your class workbook.
Session 2:
Hei Mahi:
You have 5 minutes to complete 10 Questions. Focus on the strategies you will use to solve the problems.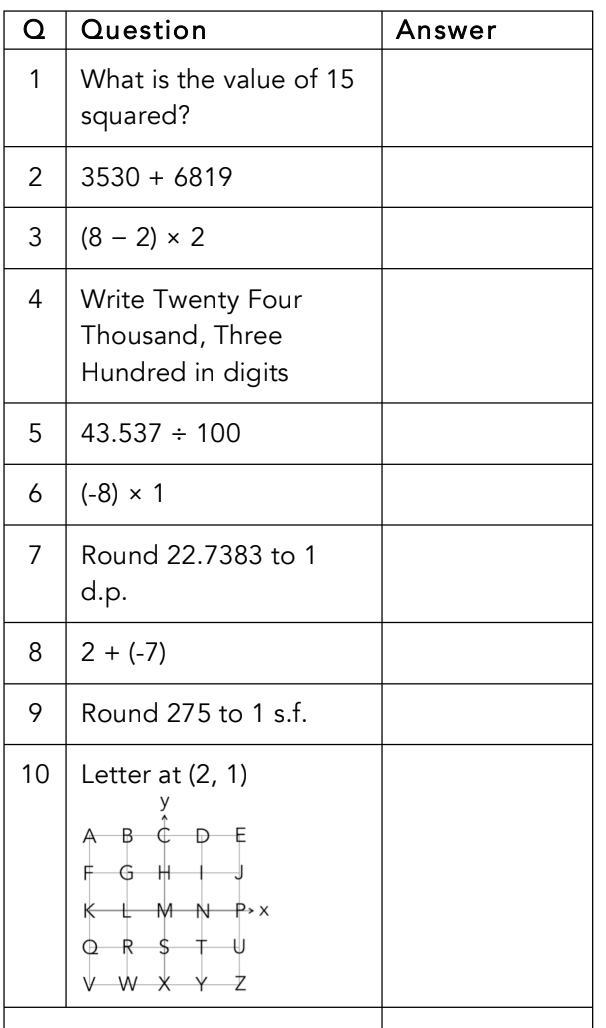
Koronga Ako:
To create a Dot Plot, read, analyse and interpret dot plots
Classwork:
Go to Google Classroom and as a group, read, discuss and answer the questions on PIE GRAPHS
Session 3:
Hei Mahi:
LUDI - Challenge yourself!!
Koronga Ako:
To be able to understand, draw and interpret Pie Graphs.
Classwork:
Work in your Groups and complete the questions on Pie Graphs in your class workbooks.