
20 February - 26 February
Section outline
-

EXPLORE / TŪHURA learning intentions:
- We are EXPLORING...the interpretation of statistical information and Reports
- We are EXPLORING...working with data and displaying of data
- We are EXPLORING...the statistical inquiry cycle.
Hei Mahi:
You have 5 minutes to complete 10 Questions. Focus on the strategies you will use to solve the problems.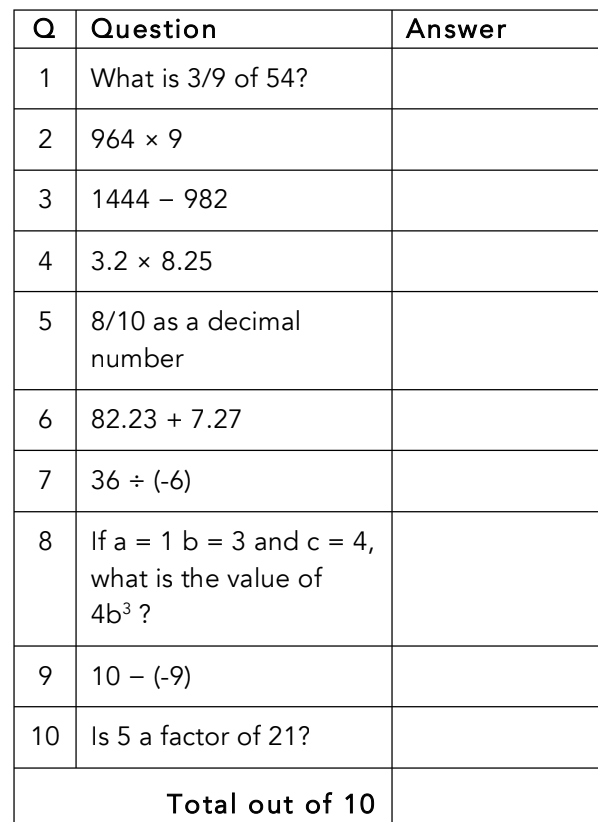
Koronga Ako:
To work out the median, mean, mode and range of statistical data.
Classwork:
Go to Google Classroom. We will mark the answers at the end of the session.
In your groups, complete the worksheets on mean, median, mode and range. Write the answers in your class workbook.
Session 2:
Hei Mahi: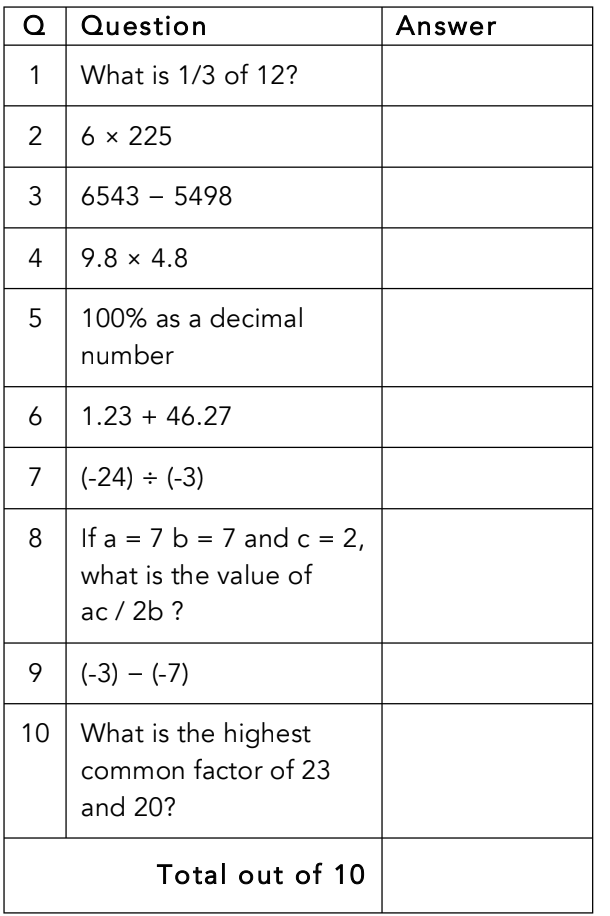
Koronga Ako
To do a tally chart and enter frequencies.
Group work:
Go to Google Classroom and complete the 2 questions on Tally charts and Frequency Tables in you class workbook.
Session 3:
Hei Mahi:
Do LUDI
Koronga Ako:Interpreting statistical displays and reports: frequency tables.
In your groups, go to Google Classroom and discuss and answer the questions in your class workbook