
13 February - 19 February
Section outline
-

EXPLORE / TŪHURA learning intentions:
- We are EXPLORING...the interpretation of statistical information and Reports
- We are EXPLORING...working with data and displaying of data
- We are EXPLORING...the statistical inquiry cycle.
Week 3:
Problem Solving: Can you solve this problem?

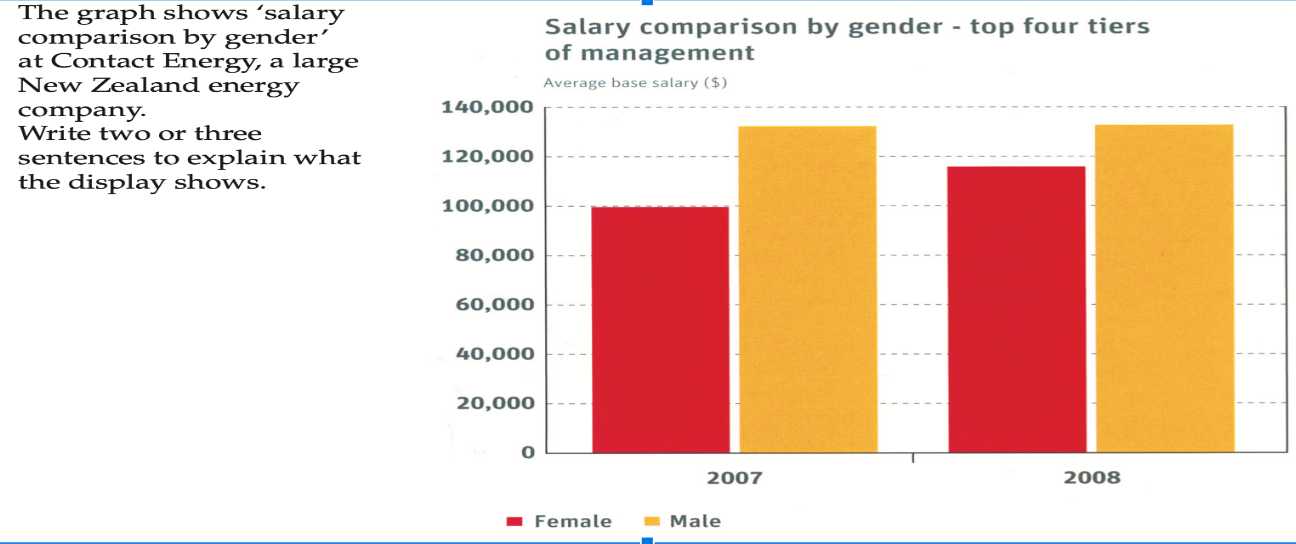
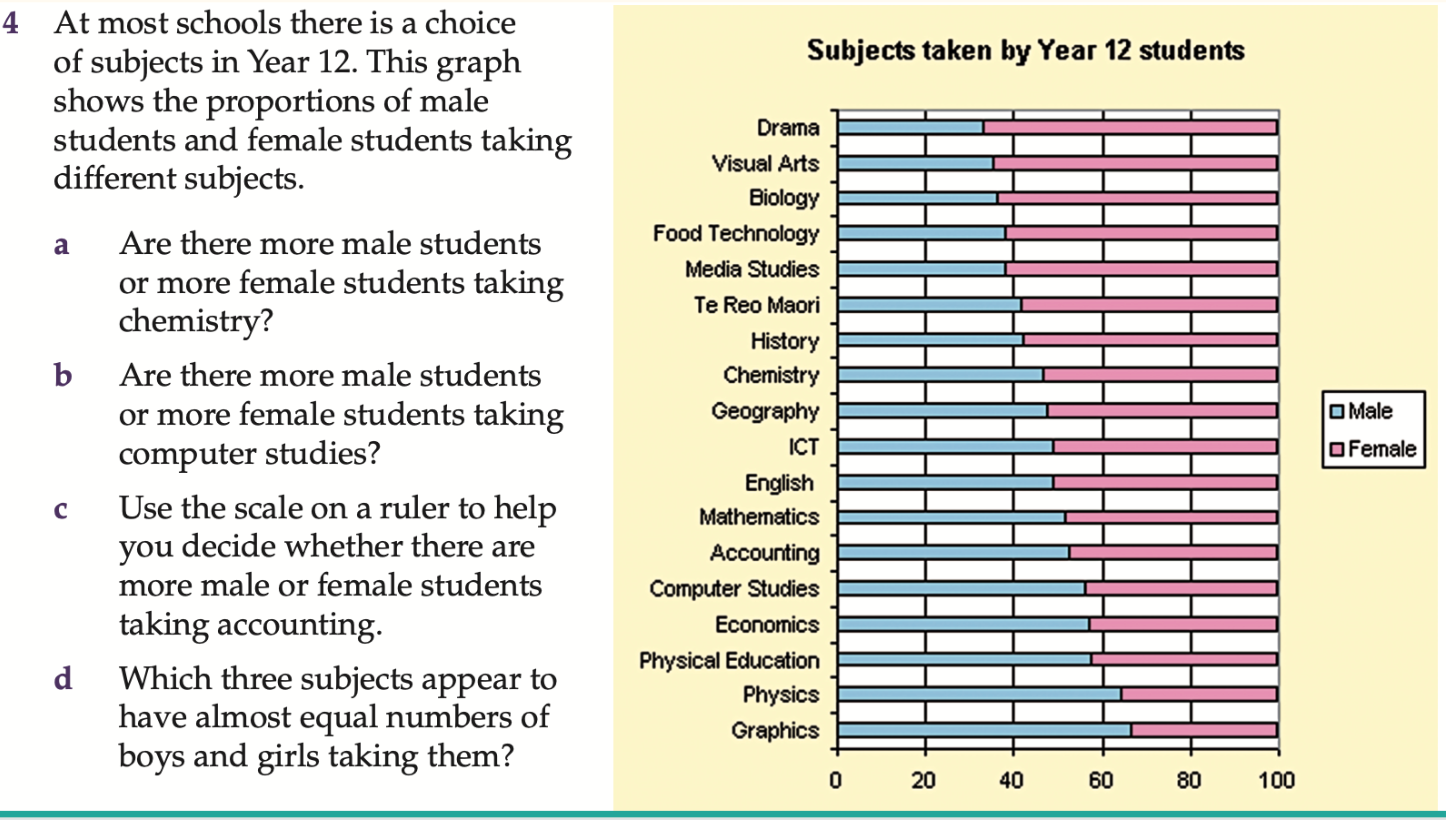
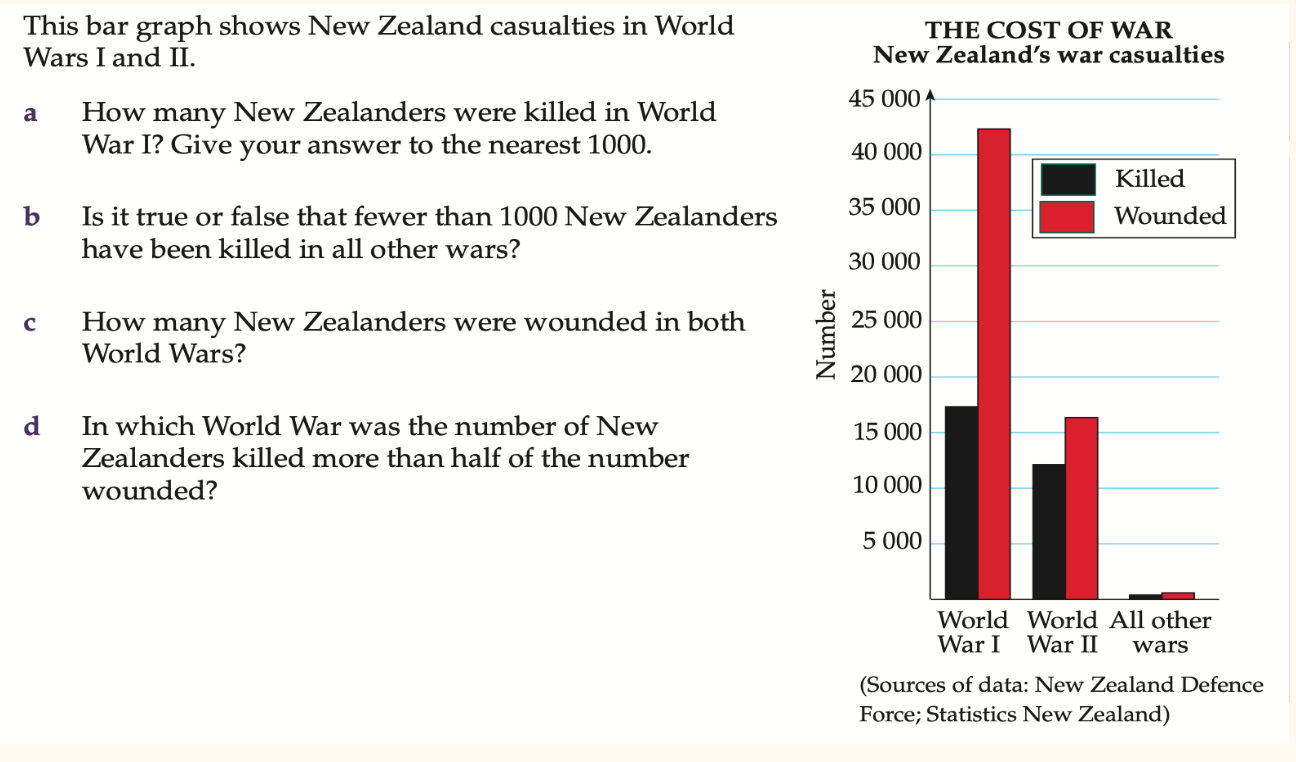
Interpreting statistical displays and reports
Once you have solved the problem, answer these 3 Statistics questions
Question 1:
Question 2:
Question 3:
Session 2:
Math problem for session 2:
Interpreting statistical displays and reports: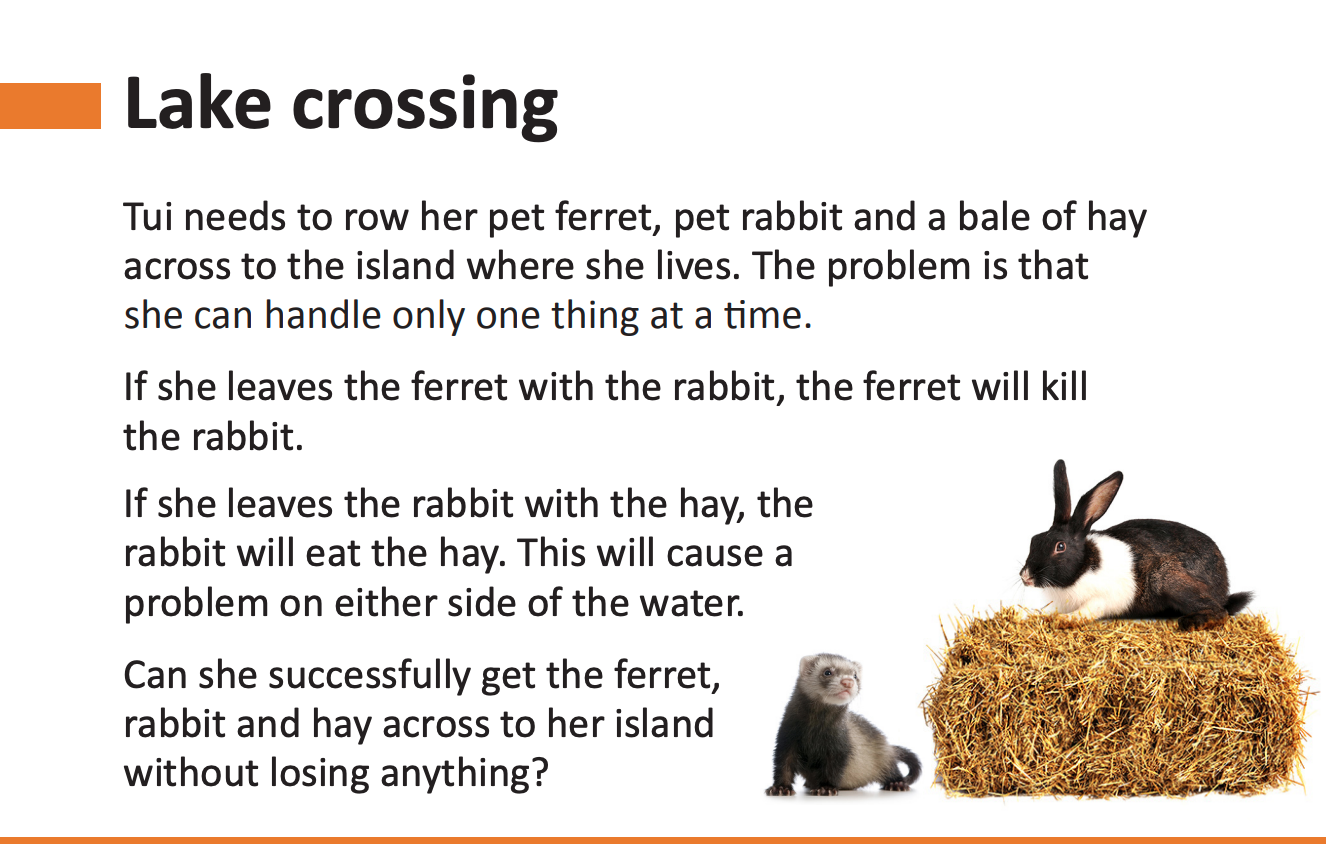
Question 4:
Question 5: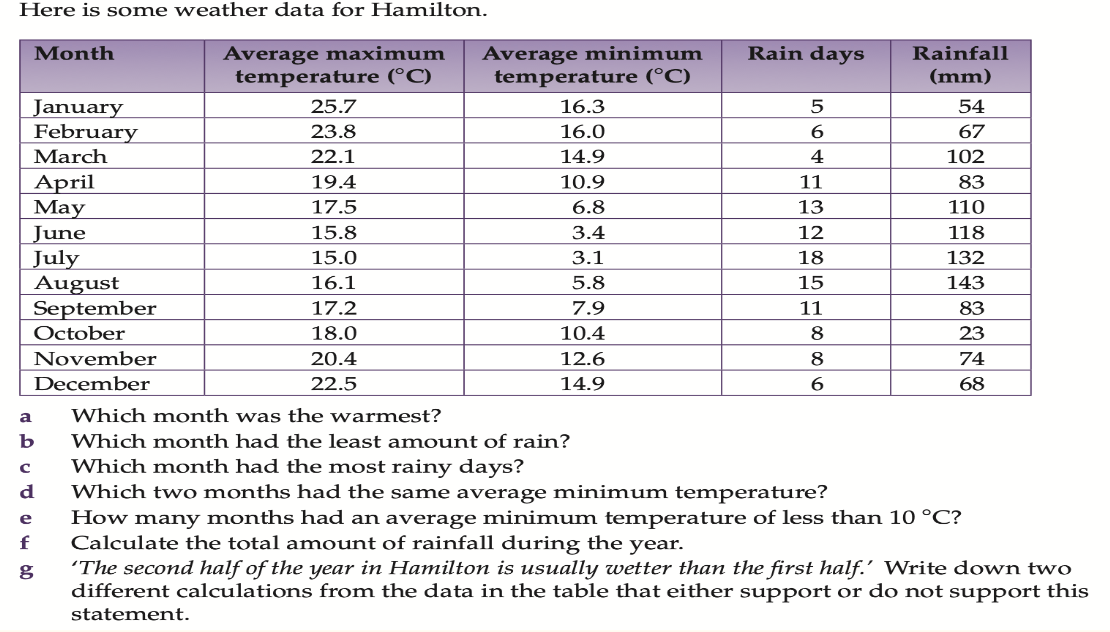
Please email your answers to me:
rjacobs@mhjc.school.nz
Session 3:
Hei Mahi:
1. LUDI
Math Problem: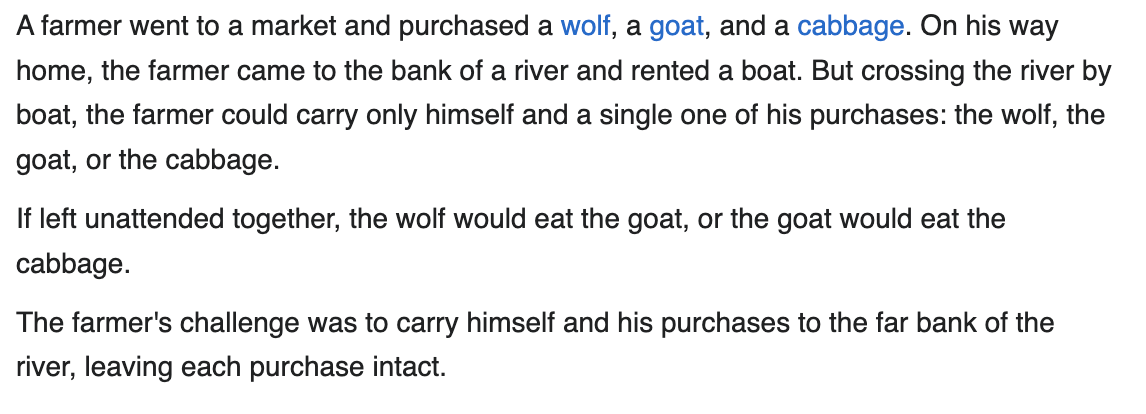
Koronga Ako:
1. Interpreting statistical displays and reports:
Group discussions