27 March - 2 April
Section outline
-

PLAN & DO / WHAKAMAHI learning intentions:
- We are PLANNING to learn how statistics are used in geography so that we can practise mean, median and mode when analysing data.
Geographers use numbers and data to interpret patterns and trends in what they are studying.
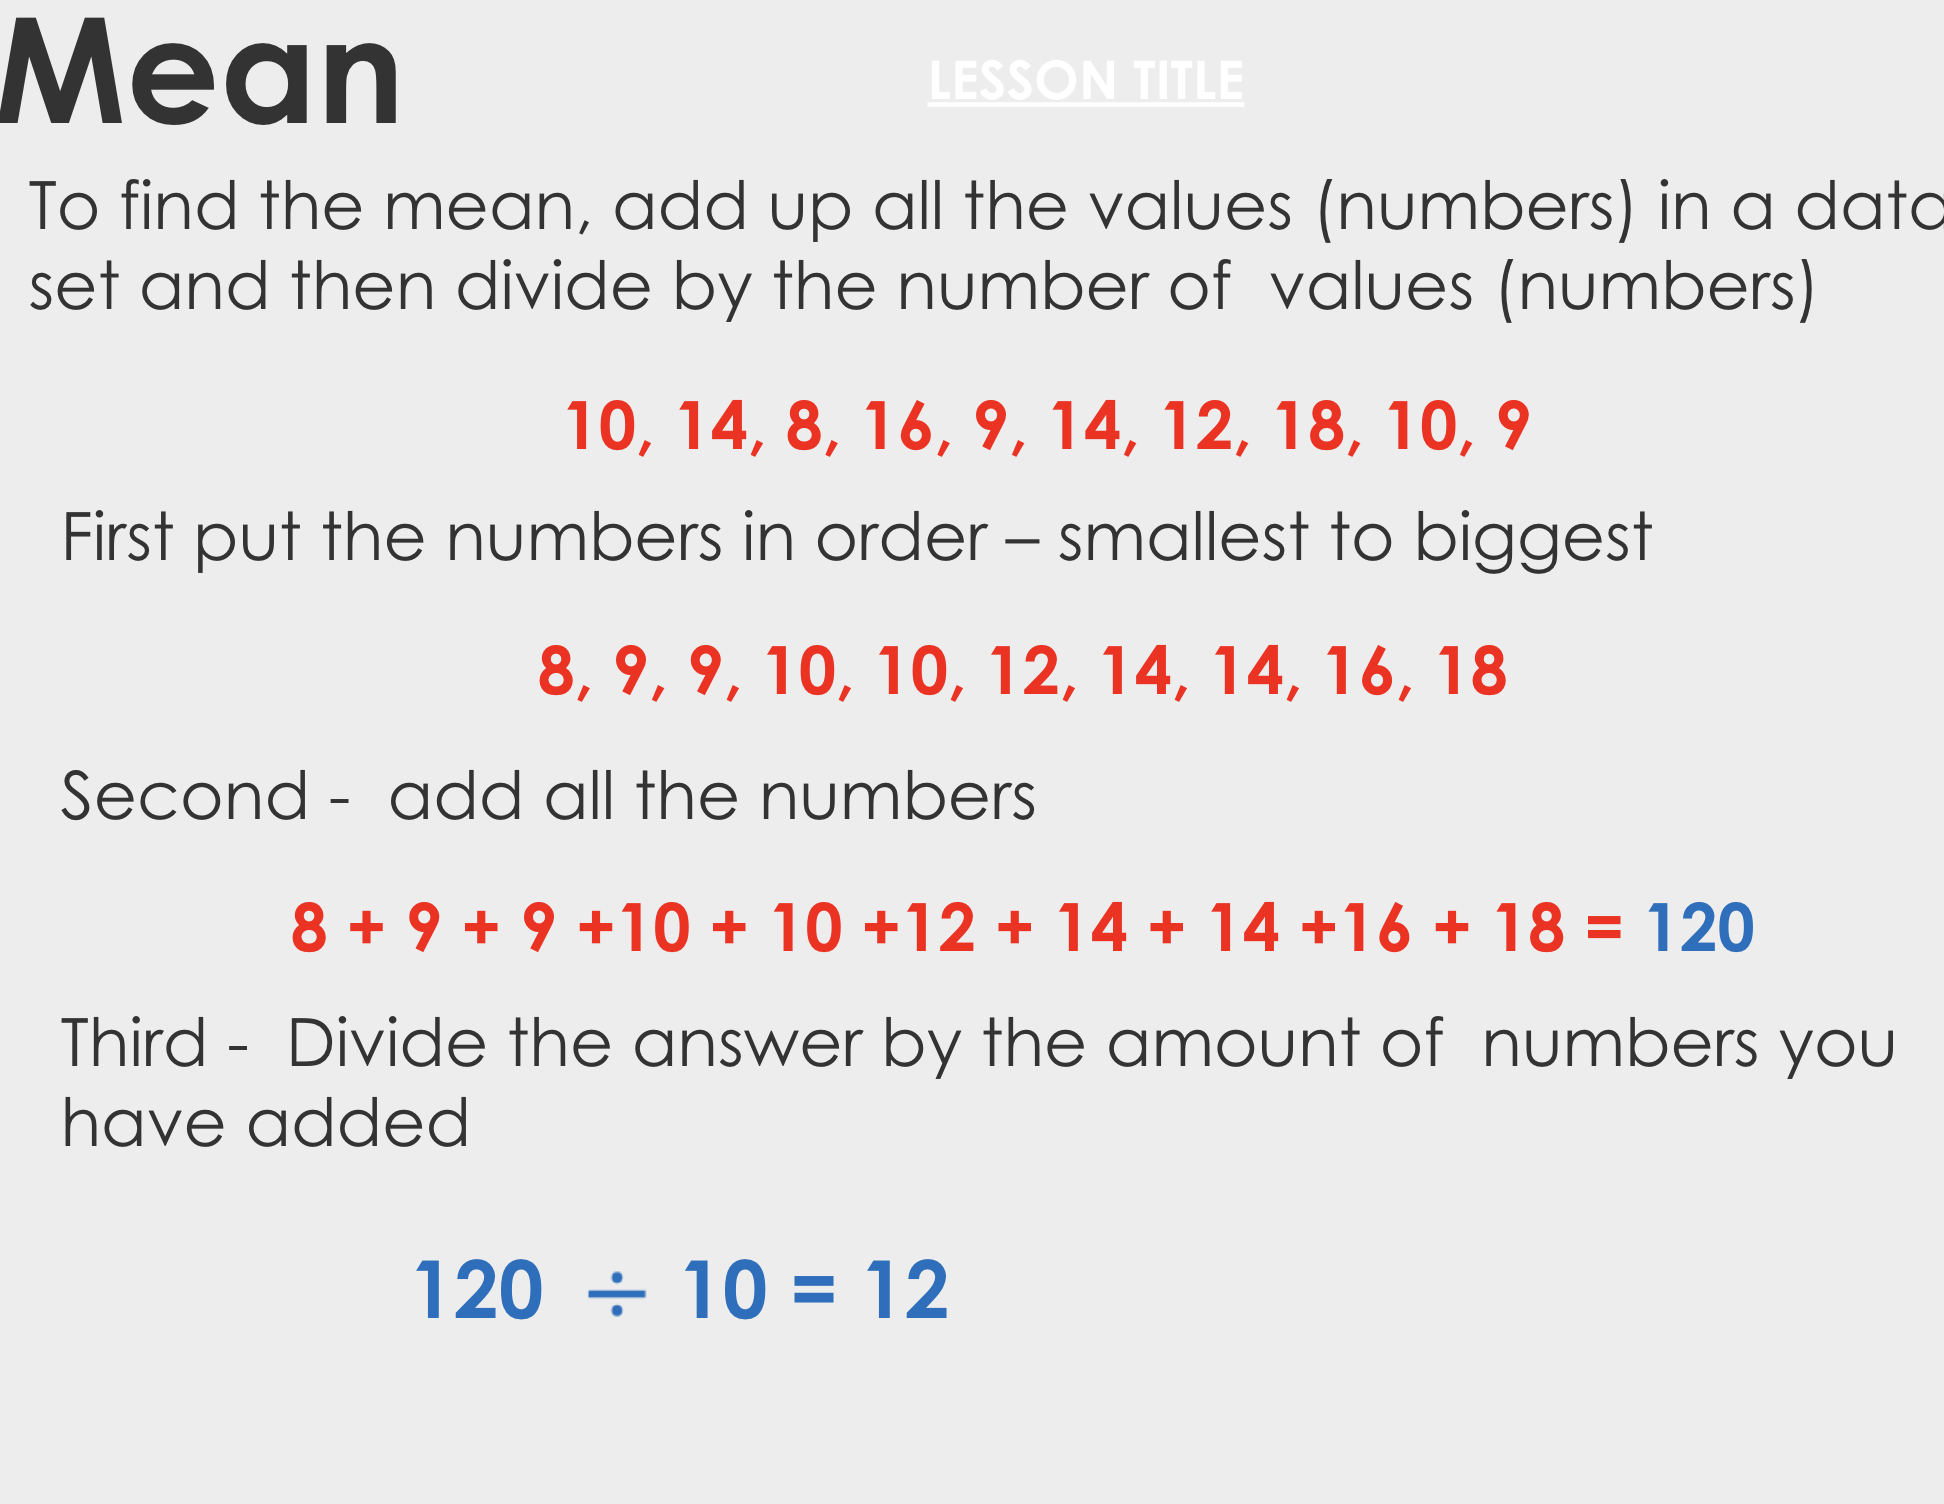
Geographers want to find the average within this data. We do this by finding the following:Mean
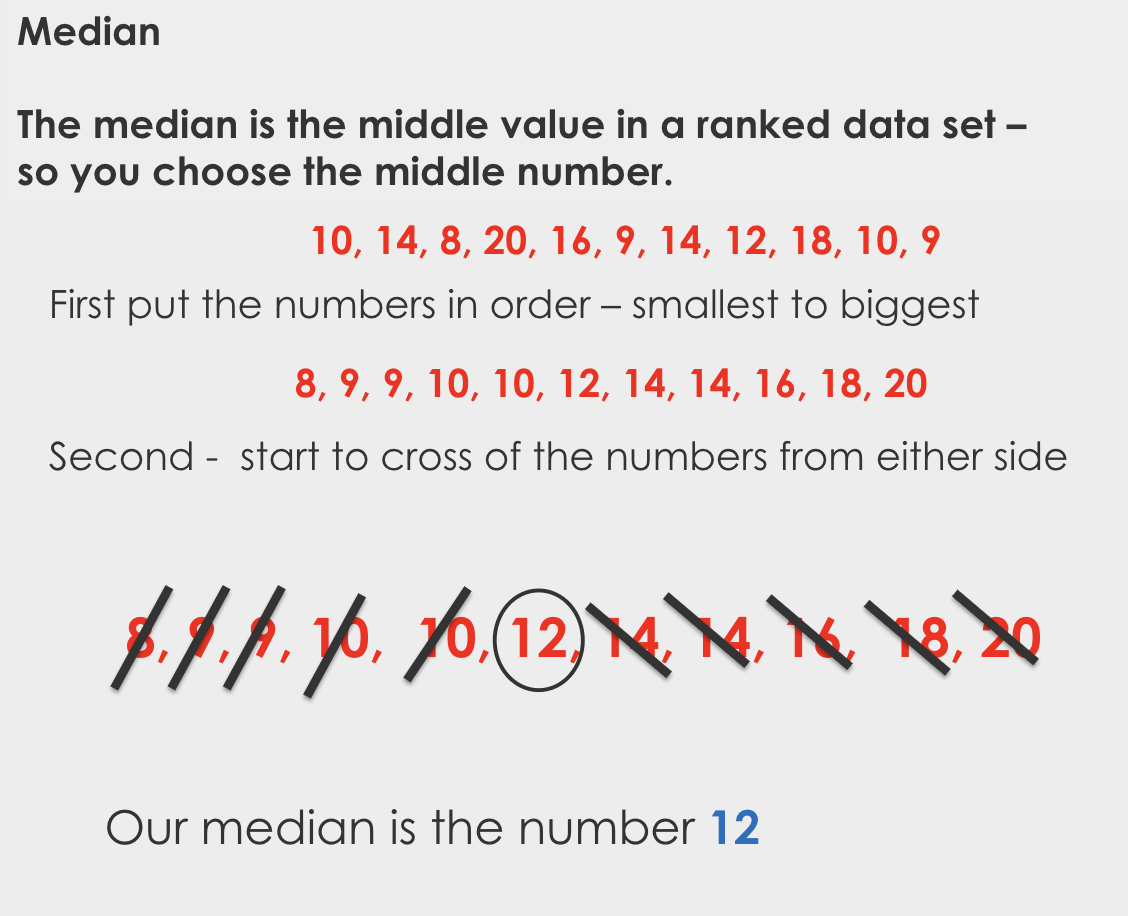
Median
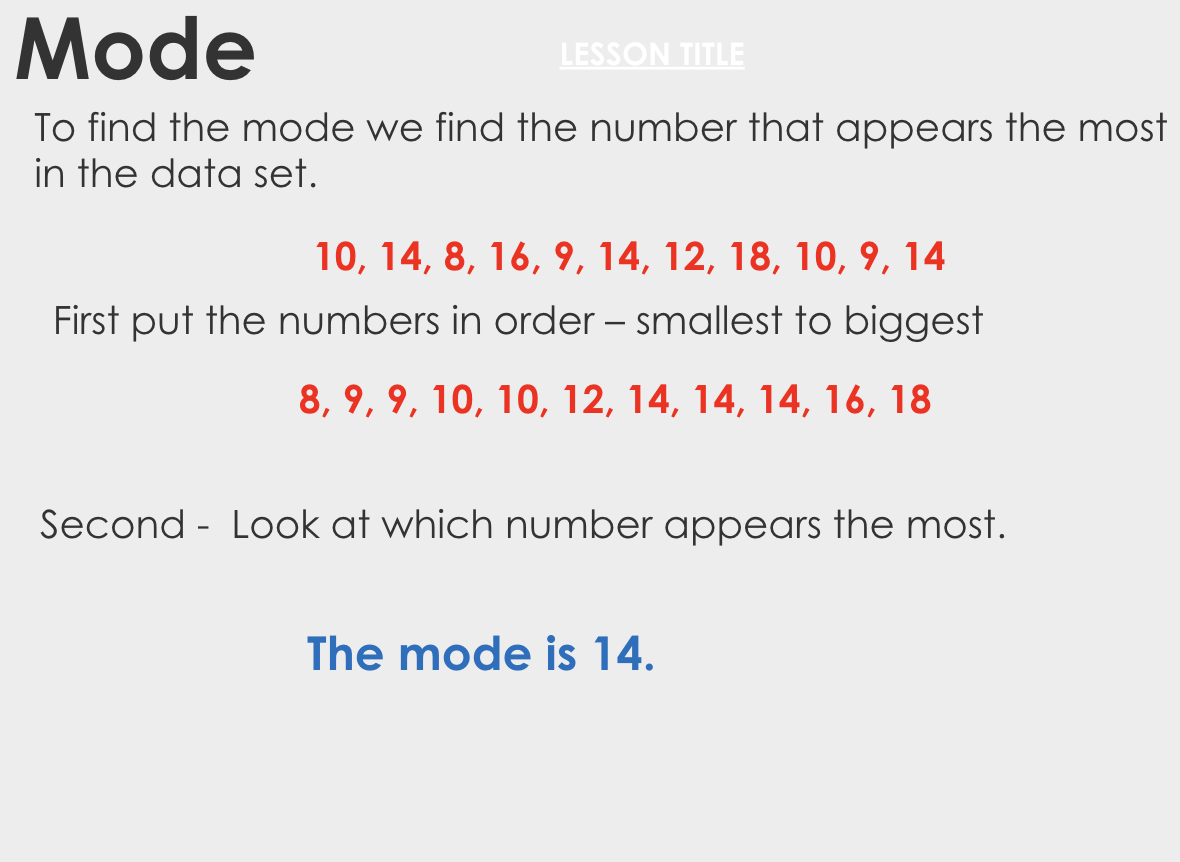
Mode
We also always put numbers in order from smallest to biggest
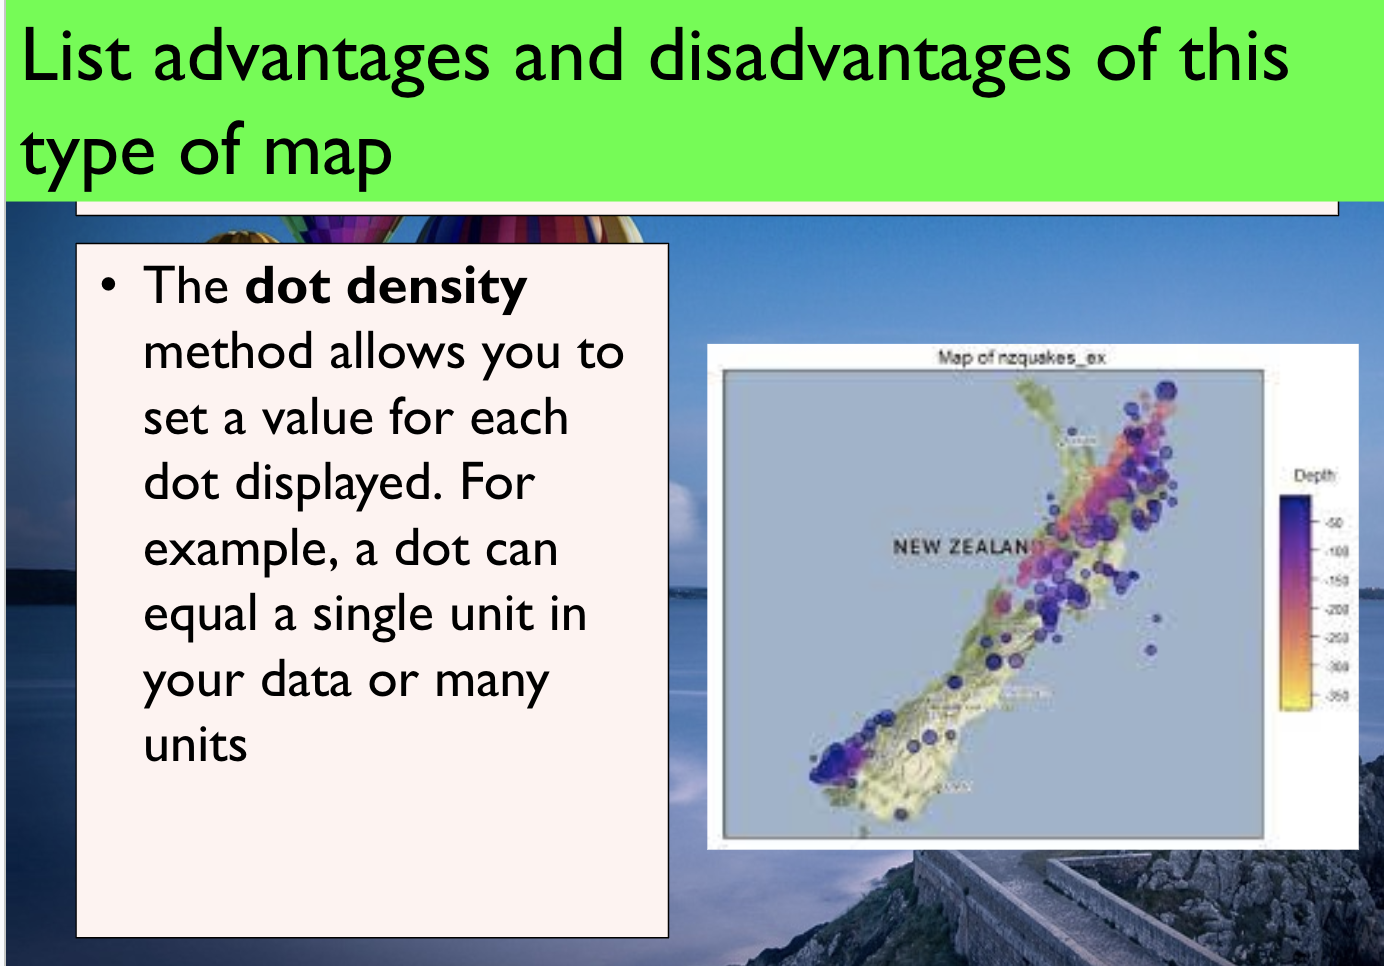
ADVANTAGES
DISADVANTAGES
ALLOWS FEATURES OF DISTRIBUTION TO BE SHOWN
GOOD VISUAL REPRESENTATION
LACKS PRECISION OF LOCATIONS
TOO MANY DOTS COULD MERGE SO UNCLEAR
AREAS COULD BE MISSED OUT IF THEY DO NOT CONFORM TO THE SCALE
ONLY INDICATE GENERAL VARIATIONS BETWEEN AREAS
difficulty of counting large numbers of dots in order to get a precise value
Need a large amount of information to draw a map
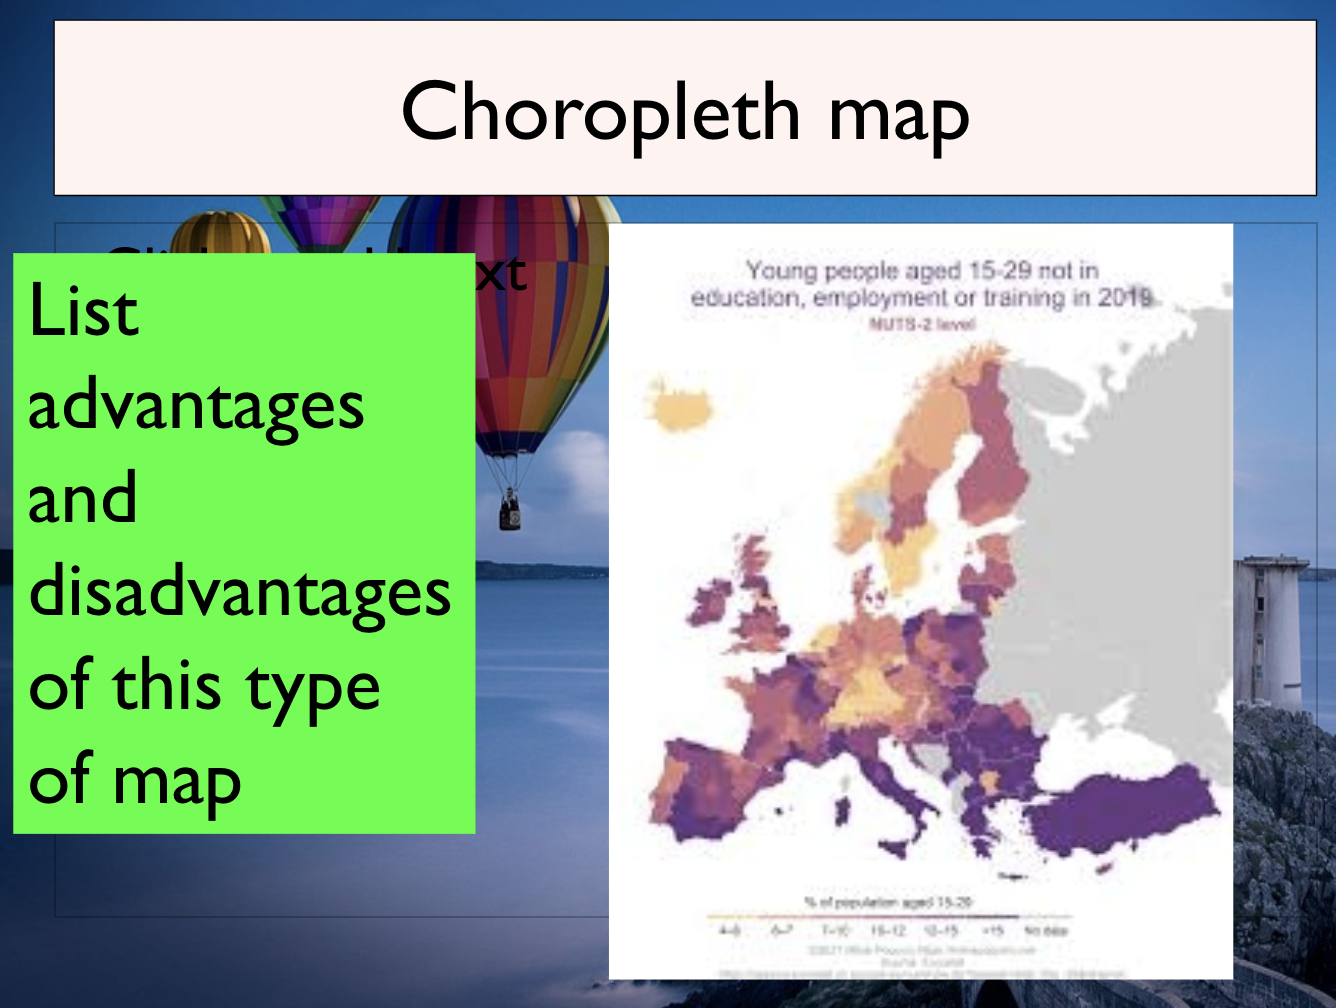
ADVANTAGES
DISADVANTAGES
VISUAL
SHOW PATTERNS CLEARLY
DOES NOT SHOW VARIATION WITHIN AN AREA
GIVE IMPRESSION THAT DENSITY CHANGES ABRUPTLY BETWEEN AREAS. IN REALITY CHANGES WOULD BE GRADUAL
CAN BE DIFFICULT TO SEE SHADING
SMALL VARIATIONS MAY BE HIDDEN
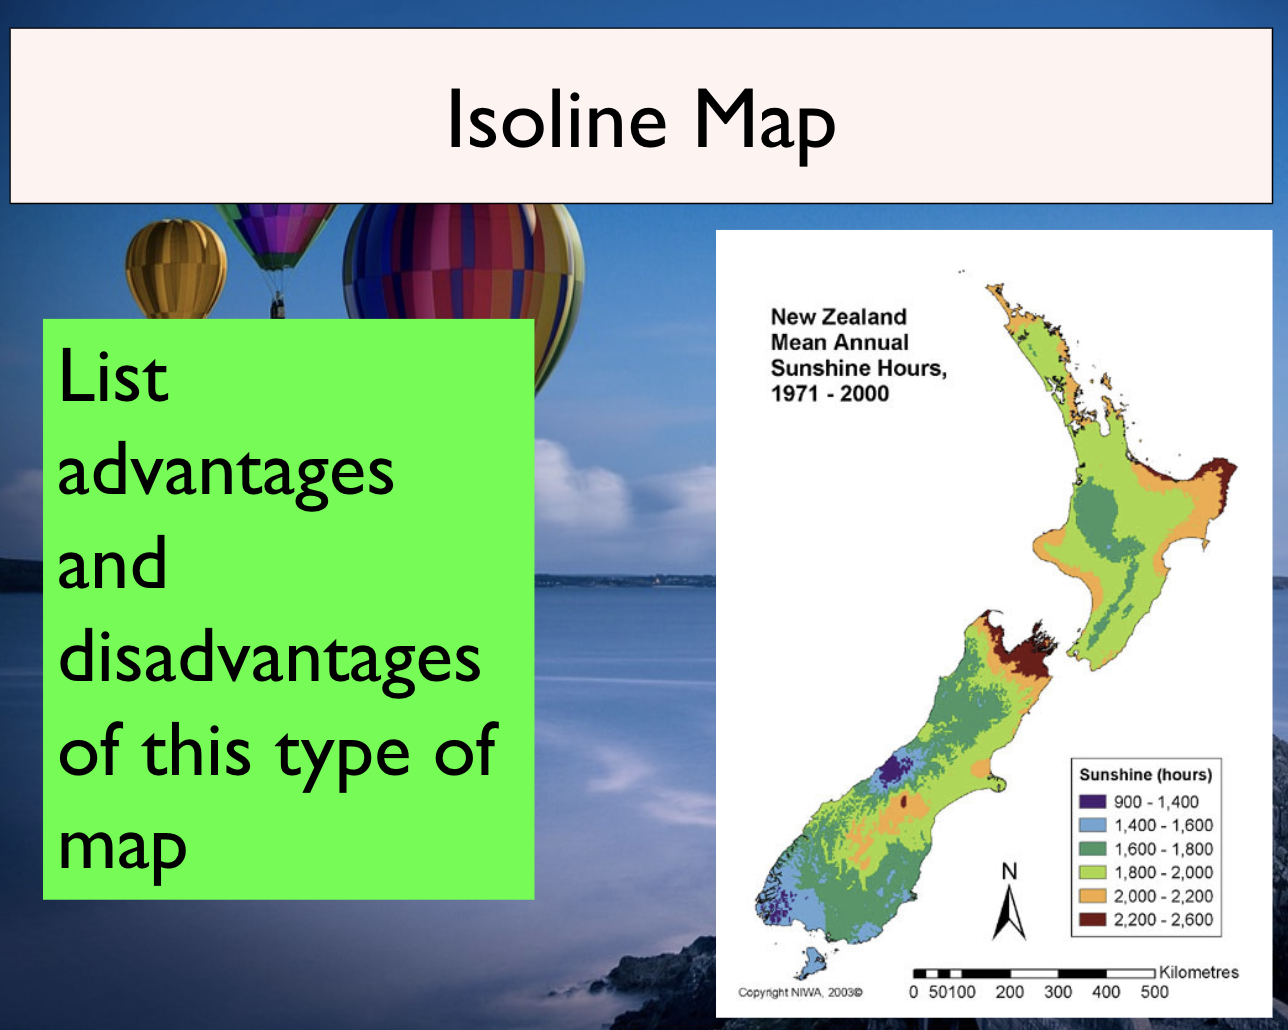
ADVANTAGES
DISADVANTAGES
No artificial boundaries so changes occur with a smooth line not an abrupt one
Can interpret general trends easily
Visually good
Not suitable for showing discontinuous data
Large amount of data needed