
25 July - 31 July
Section outline
-
Term 3 Week 1
Wecome back Y18M1. Hope you had a great term break.
Learning intentions for week 1.
We are learning to:
- connect number patterns and use tables, graphs, and diagrams to find relationships between successive number. L3.
- Use graphs, tables, and rules to describe linear relationships found in number L4.
- relate tables, graphs, and equations to linear relationships found in number. L5.
- relate rate of change to the gradient of a graph. L6.
Revisit last term's work by Mr. Hishey by completing Kahoot and Mathsbuddy question bank.
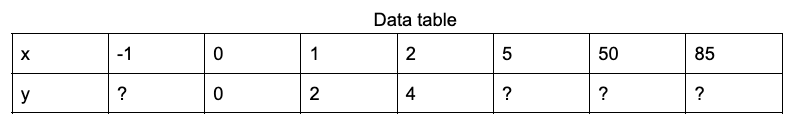
Q1. a) Look for a pattern in the number sequence.
b) Then complete the data table.
c) Plot the coordinates using x, y axis and joint the coordinates with a straignt line
d) Calculate the unit rate( Rise /run) which will be the gradient (m) in y=mx+c
e) When x= 0, y = 0. Because, when f(x) =0 in y=mx+c, y = ?
f) From your graph create the rule, what is your y=mx+c?
g) Use your rule to solve, when f(x) = 85, y =?
h) confirm the graph is correct using y=mx+c.
i) Identify the idependent/dependent variables? explain.
j) Is the gradient positive/negative? Why? explain.
k) Explain c in y=mx+c. Why is c important?
Tue: Complete Q1 upto d).
Wed: Complete from e) to g).
Fri: Complete h) to k). Done!