
4 May - 10 May
Section outline
-

Term 2, Week 4
This week we are starting our new context for term two - Superstars.
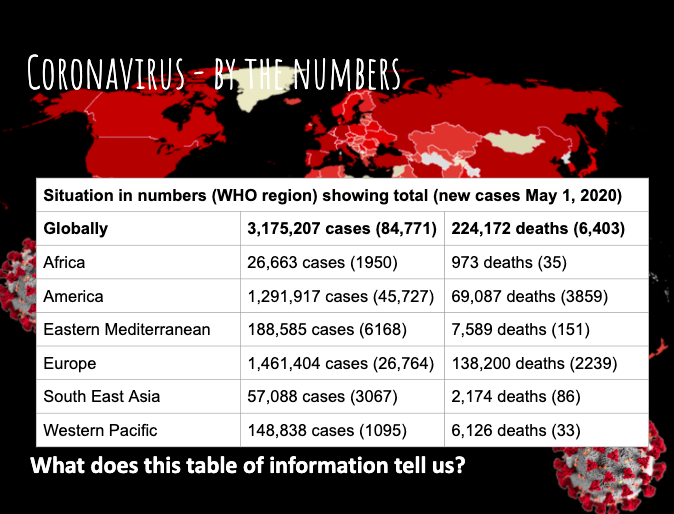
For our learning, we are going to start by investigating data provided by the WHO (World Health Organisation) on the Global Coronavirus Situation in Numbers. We will then design and construct a variety of graphs to identify data relationships, followed by analysing the data so we can make statements and comparisons.
The skills we will learn will also help us to become Superstars with our Science Fair Project and our Minute to Win it Challenge, in PE in Health.
Learning intention: (We are learning to…)
- Analyse data and display in graphical format using Google Sheets.
Success criteria: (I can…)
- Collect data
- Sort information into categories
- Record data in tables
- Plot graphs to identify relationships between variables
- Answer questions by sorting, organising and arranging information
- Make statements about the findings
Activities:- Watched a short video on 'Which Graph to I use?'
- Developing an understanding of how to read data tables
- Discovering an understanding of the global coronavirus numbers by region
- Transforming the data into spreadsheets
- Practising how to set up a graph using spreadsheets
- Designing a pie chart using topline data - learning skills of titles, sorting etc.
- Publishing our learning onto one page shared class Google Sheet
- Demonstrating our understanding by making statements about the data
- Learning skills as a class of collaborating and sharing our learning
Homework- Priority: Maths Buddy
- Classwork: No class homework this week, unless you contact me for help with your graph.
- Education Perfect: Tasks have been set for you to do, at your leisure, based on your Term One Assessment Grade for Numbers.

EXPLORE / TŪHURA learning intentions:
- We are EXPLORING... statistical inquiry model - by observing data, carrying out statistical investigations, collecting and organising discrete data, grouping data, graphing - histograms, leaf graphs, pictograms, plot graphs, strip graphs, percentage graphs, calculating pie graphs using a protractor, creating time-series data, and organising data to analyses and write statistical reports.
- We are EXPLORING... algebra - generalising and representing the patterns and relationships found in numbers, shapes, and measures, observing and carrying out algebraic convictions, substituting variables, expanding, factorising.

FOCUS / ARONGA learning intentions:
- We are FOCUSING...our learning on developing our statistical skills by identifying areas we need to focus on.
- We are FOCUSING...our learning on developing our algebraic skills by solving a variety of mathematical problems.