
Term 3 Week 2 (27-2 Aug) Production Possibility Curves
Section outline
-
Learning Intentions
- To understand how limited resources affect what NZ can produce (and earn)
- Able to show in a graph how limited resources affect what can be produced in NZ
Production Possibility Curves (PPC)
It is useful to show on a graph the maximum that we can produce with available scarce resources. To do this though, we have to pretend that we can only produce 2 products. Such a graph is called a PPC. Imagine that we can choose to produce surf boards and / or Moro bars. The curve below shows that we could produce any combination of these 2 products up to the line (eg points A and B, but not outside it (point C).
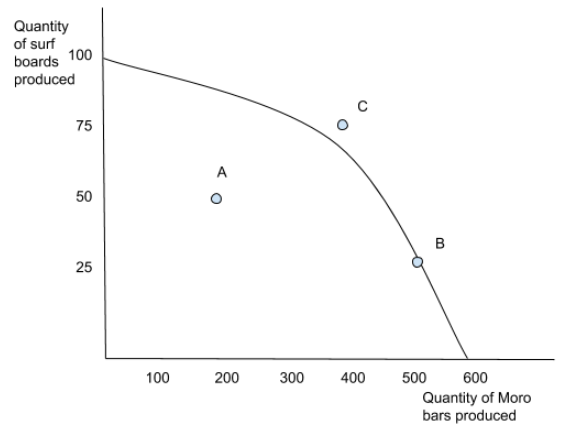
For example, we could produce 50 surf boards and 200 Moro bars (point A), or 25 surf boards and 500 Moro bars (point B). We do not have enough resources to produce 75 surf boards AND 400 Moro bars (point C).
Activity
Discuss in your group what would happen to the PPC curve (quantity that can be produced) if:
- more immigrants came to the country
- an earthquake destroyed factories and roads
- there were widespread floods across the country
- more efficient machines were developed that could produce more Moro bars
Activity
Watch this video clip of the NZ earthquake. Seeing the damage caused, think about what the effect was on the region's resources (land, labour and capital), ability to produce products and Production Possibility Curve.
Activity
Complete the Google Doc in Google Classroom called Intro to Economics.